


Epi, ability to pay willingness to pay model
Epidemiological, Ability to Pay and Willingness to Pay Model
Epidemiological Data
TYPE OF DATA
The Epidemiological data can be either
- provided by the client or a third party contracted to the client or
- provided by Global Demographics Healthcare Ltd at an additional fee.
It will then insert it into the model for use by the client. Being a closed model (i.e. not online etc) the data remains secure to the client.
For Non-Vaccine Analysis
The Epidemiological data can be either Prevalence or Incidence
- Prevalence is typically shown as cases per 100 as shown in the example on this page.
- Incidence is typically cases per 100,000
For Vaccine Analysis
In the case of Vaccines the data can be different. Specifically it is appropriate to all persons in a selected age range. For example children under 10 years of age.. As such the prevalence rate is zero (0) for all ages outside that range and 100 for those within the age range.
However, there may be other considerations such as having had a particular condition already, in which case the prevalence rate for those within the designated age range would reflect the age/gender prevalence rate for that age/gender group.
While not essential, ideally there should be individual data sets for each country but in the absence of such data surrogate sets may be used.
Ideally the data is provided by gender (as prevalence/incidence does differ by gender for most conditions) and by 5 year age steps. We have the ability to fill out the entire matrix in the absence of complete data sets and such service is available on request.
The years covered depends on the objective of the client. We can modify the model to extend to 2045 but ideally 16 years is sufficient in terms of market planning.
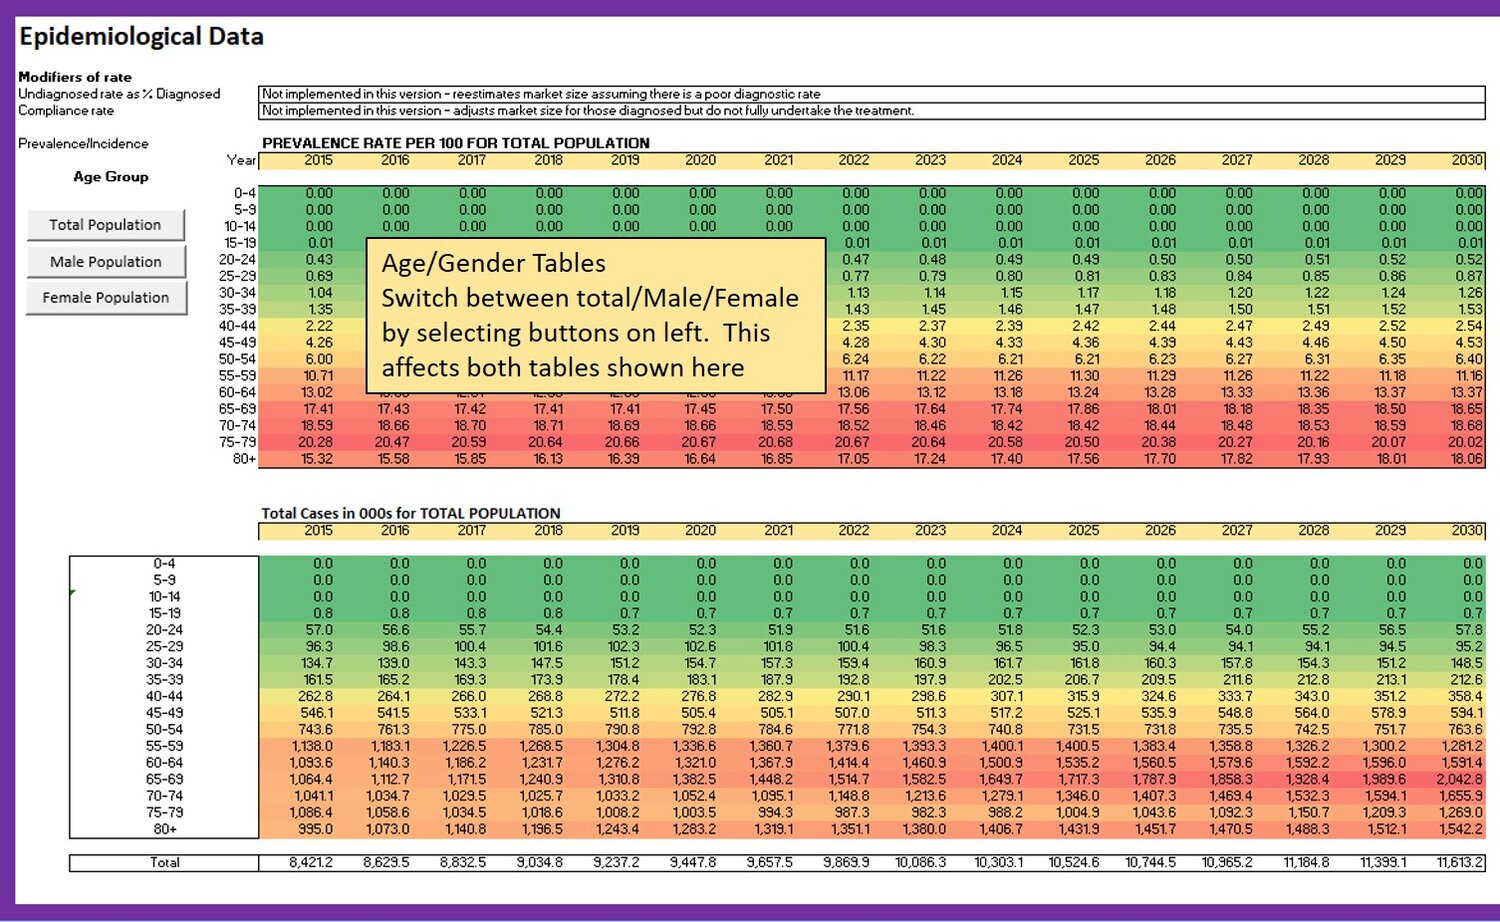
Note: The epidemiological data and estimated number of cases reflects the earlier selection in terms of total/male/female populations. The buttons to switch between the three segments are also available in this section but affect all relevant tables in other sections as well so that the data is consistent in terms of the ‘market’ being profiled..
THE TABLES (SEE BELOW)
Prevalence/incidence rate
The first of the two tables in this section (and as shown here) is the basic prevalence or incidence rate (in this example it is prevalence).
To avoid scrolling you can see the profile by gender and for the total population by clicking on the appropriate buttons on the left. The selection here affects both the tables in this section and those in the other sections of this model.
Number of Cases
The second table in this section is the total cases by age/gender. It is the number of persons in the data cell multiplied by the incidence or prevalence rate for the cell.
Note, the data in this table is persons in 000s for prevalence but for incidence data it is persons (singular – ie 1 means 1 person).
Diagnostic Rate
This allows the user to vary the diagnostic rate and effectively re size the market. In some countries the access to health services may be currently limited but improving. As such the number of diagnosed cases may increase faster simply as a result of improved diagnostics rather than a fundamental change in the propensity of the population to have the condition. The user would for example set current rate at 50% and increase that to 80% by 2030. The model will modify the real market size (Diagnosed plus Undiagnosed) accordingly.
Treatment
In some markets the cost relative to income may be such that the patient does not complete the treatment/course. As such the market is smaller than indicated in the above table.. The user can set a compliance rate for each year to get a more conservative estimate of the market size and value. This affects the values shown in the ‘Total’ row at the bottom of this section.
GO TO THE NEXT SECTION OF THE MANUALBy 2045
The total population of China is projected to decline to 1.378 billion persons – down from 1.411 in 2020 (Census). This assumes the average birth rate per thousand women aged 15 to 49 increases from 44 (in 2019) to 50 in 2024 and then declines to 46 by 2045, reflecting trends in improved education and affluence.
Annual births in 2024 are expected to be 15.7 million and are projected to decline to 12.4 million by 2035 and 11.541 million by 2045.
For more information on births in China, see our Special report on this topi
Learn More