


Epi, ability to pay willingness to pay model
Epidemiological, Ability to Pay and Willingness to Pay Model
Scenario Model 1 – Market Size over time
There are two scenario models in this program.
- This one looks at the potential size and value of the market given a price for each year.
- The other (see separate web page) helps you determine the optimum price point for a specific year depending on your priorities – market volume or revenue.
Market Size Scenario
This is relatively simple in nature – it simply works out the number of persons that will pay for the treatment given:
- they have the condition
- they can afford to pay for it at the selected price point for the year (given their income),
- and are in the sub sample that has been selected for this part of the analysis (eg young women) and
- their willingness to pay (given their household income)
You can run as many different price scenarios as you want for the selected population. If you want to look at a different segment you need to change the segment selected in the willing to pay segment (previous section).
The steps for using it are quite simple
1: Set Price For Each Year
In the row labelled ‘Set Price Point USD pa per user’ enter the intended price for each year. Ensure it is in the selected currency.
To make it easy you can select the button ‘Clear Price Range’ which will clear any values in that row between the first and last year. You then enter/change the values for the first and last years – and any intervening years (need not be all) and then click ‘Fill missing values in Price Array’. The program then fills in any empty cells with a linear trend between known points.
2: Click ‘Run Scenario’ button
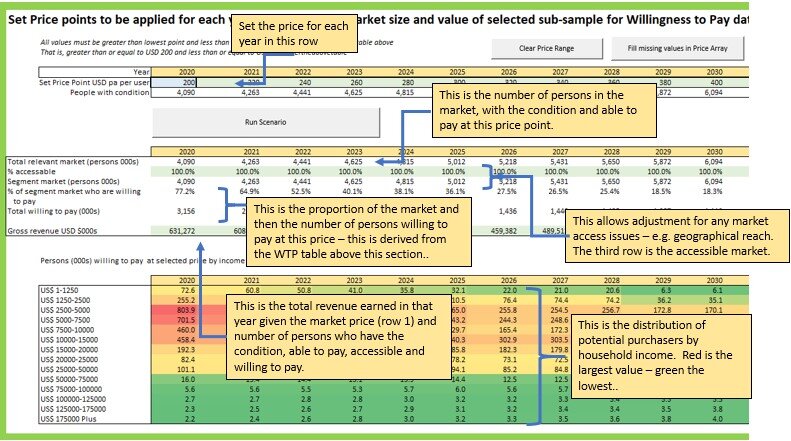
The program will determine the market size and value given the proposed pricing for each year and the number of persons in each year that qualify as the target market (Have the Condition, Able to pay at that price and willing to pay at that price). The rows in this section are:
- 1. The TOTAL number of such persons in the market (i.e. have condition and able to pay at the price point for the year) is shown in the row immediately under the price points and also as the first row in the next table.
- 2. The second row (‘% accessible’) allows the user to exclude some of the market which perhaps cannot be reached – for example live in remote areas etc.
- 3. The third row is the resulting accessible market
- 4. Percent of market willing to pay
- 5. Number of such persons (i.e. with condition, accessible, able to pay and willing to pay)
- 6. The revenue that would be earned if all those willing to pay actually pay.
MARKET SIZE TABLE
Having determined Ability to Pay and Willingness to Pay the final stage is to size the market
The next table does that – but there are two forms of it depending on whether it is the Vaccine version or the Standard Version.
Epidemiology Version
This table shows the distribution of this market by income level in each year. (Remember all financial data is in real 2019 values). The values shaded in red are the highest values.
It also shows total sales and Gross Revenue for each year given the price points entered in the blue row at the top.
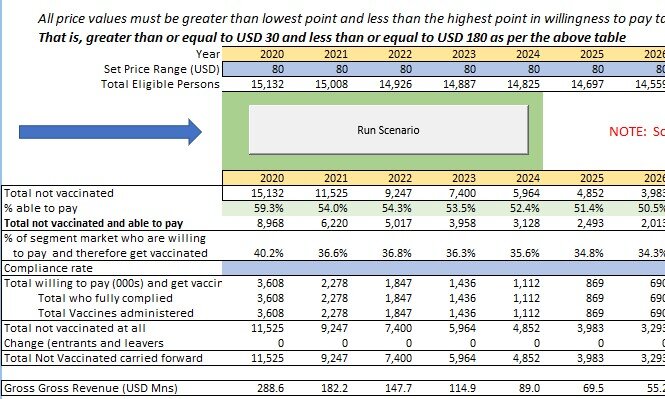
Vaccine Version
This is very similar to the Standard version except the table assumes that once vaccinated a person does not return to the market. i.e. the Vaccine lasts, As such it deducts those vaccinated from the total who are able and willing to pay. It also adjust for those entering and leaving the eligible age range.
The row marked ‘Total Vaccines Administered’ is total uptake in that year and the Gross Revenue row is that row times the price for that year (blue row at the top of this section.)
The model deducts the vaccinated persons from the total who were not vaccinated at the start of the year and that gives the new total for the next year.
By 2045
The total population of China is projected to decline to 1.378 billion persons – down from 1.411 in 2020 (Census). This assumes the average birth rate per thousand women aged 15 to 49 increases from 44 (in 2019) to 50 in 2024 and then declines to 46 by 2045, reflecting trends in improved education and affluence.
Annual births in 2024 are expected to be 15.7 million and are projected to decline to 12.4 million by 2035 and 11.541 million by 2045.
For more information on births in China, see our Special report on this topic
Learn More