

Projected Growth and Location of Affluent Households in China
Synopsis
- The combined effect of growing total real GDP and an increased share of that going to the consumer means that Household Incomes in China will double in the next decade to 2022.
- This increase in household income means that the distribution of households by income expands out and the higher income segments are where the growth is. (The lower income segments decline in number of households).
- For commercial success (i.e. profitable sales and growth) in China it is important to focus on those income segments which are growing in number of households and have an income level to permit a reasonable gross profit margin.
- In the current (2013) situation this means targeting households with an income over Rmb 140,000 (circa US$22,000) per annum before tax. Such households are typically two person (and over 40 years of age) and after tax and savings they are spending on average of Rmb 54,000 (US$8,700) per annum per capita. They are also (98%) urban.
- The Before tax Rmb 140,00 Household represents 9% of households in 2012 (17% of urban households) and increases to 28% of all households (43% of Urban) by 2022 – significant share growth. In 2012 the urban affluent totaled to 37.7 million households increasing to 114 million by 2022.
- However, China is a large geographical area so reaching 9% of households cost efficiently is a challenge for any business. Fortunately such the high income households are concentrated in relatively few urban areas
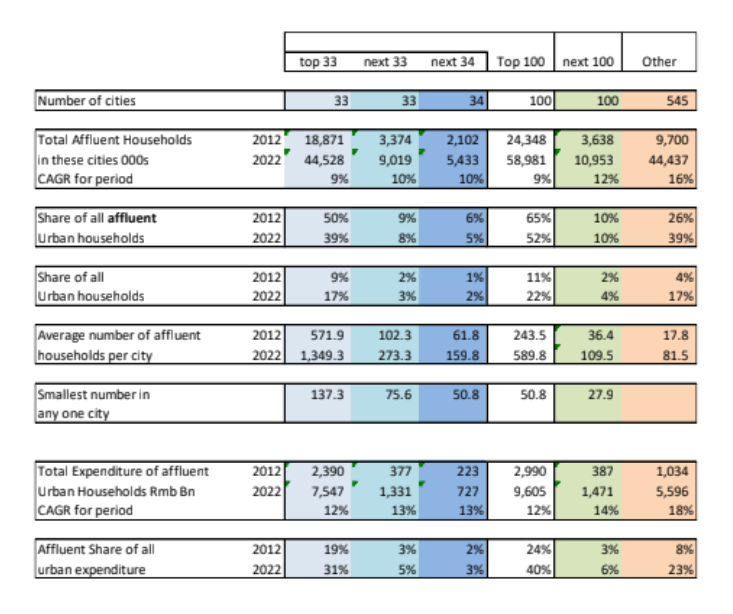
- There are 845 counties (cities) with an urban population greater than 200,000 in 2012. However, just 33 account for 50% of the urban households with a pretax income in excess of Rmb 140,000 in 2012. Furthermore, 100 cities will reach 65% of the urban affluent households.
- The key 33 cities share of affluent urban households declines to 39% by 2022 as affluence spreads, but in absolute number of affluent households (i.e. urban households with a pre-tax (gross) income greater than Rmb 140,000) these cities increase from having 18.8 million such households to 44.5 million households.
- The attractiveness of this segment should not be under estimated. While the number of affluent households in the top 100 cities account for 11% of urban households in 2012, they account for 24% of all urban expenditure. In 2022 they account for 22% of all urban households and 40% of all urban expenditure. Getting a strong position in this segment now is probably a sensible strategic move.
HOUSEHOLD INCOMES AN OVERVIEW
Key Assumptions Impacting the Trend in Household Incomes: Total Real GDP Growth
household incomes are:
- Growth in total real GDP
- Share of GDP that reaches the consumer (Private Consumption Expenditure).
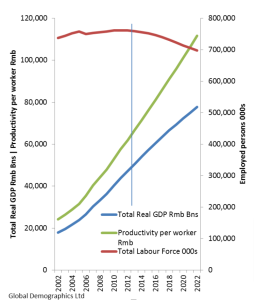
In terms of total real GDP the combined effects of a declining total workforce and slower skill, and hence productivity, growth per worker means that it cannot be expected to grow much faster than an average 5.1% per annum for the next decade. Declining from 7.5% in 2012 to 3.7% by 2022.
The slower skill increase is a function of
- Fewer young, better educated, people entering the labour force (as a result of ageing of the population)
- A significant reduction in the number of rural urban migrants due to the rural areas being hollowed out in terms of young people.
Key Assumptions Impacting Trend in Household Incomes: Share of GDP that reaches the Consumer
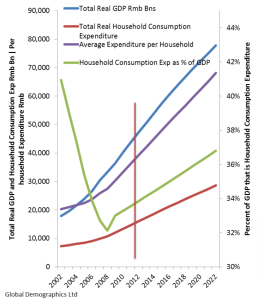
The share of total GDP that reached the consumer declined significantly from 2002 to 2008 and then started to increase through to 2012. As a result for the period to 2008 household expenditure and incomes showed little real growth.
Stated Government policy is to lift this share in future. While the norm for most countries is around 55% to 65% it is considered that in the next decade in China it will increase from 34% in 2012 to about 37% in 2022. A faster rate in the context of a growing real total GDP would cause such a rapid increase in real consumer affluence that inflation would be a serious issue. The increase is however, unlikely to be less than that.
This Increase (by whatever amount) will happen as the Government, through State Owned Enterprises (SOEs), is the largest employer and can effectively set wage rates.
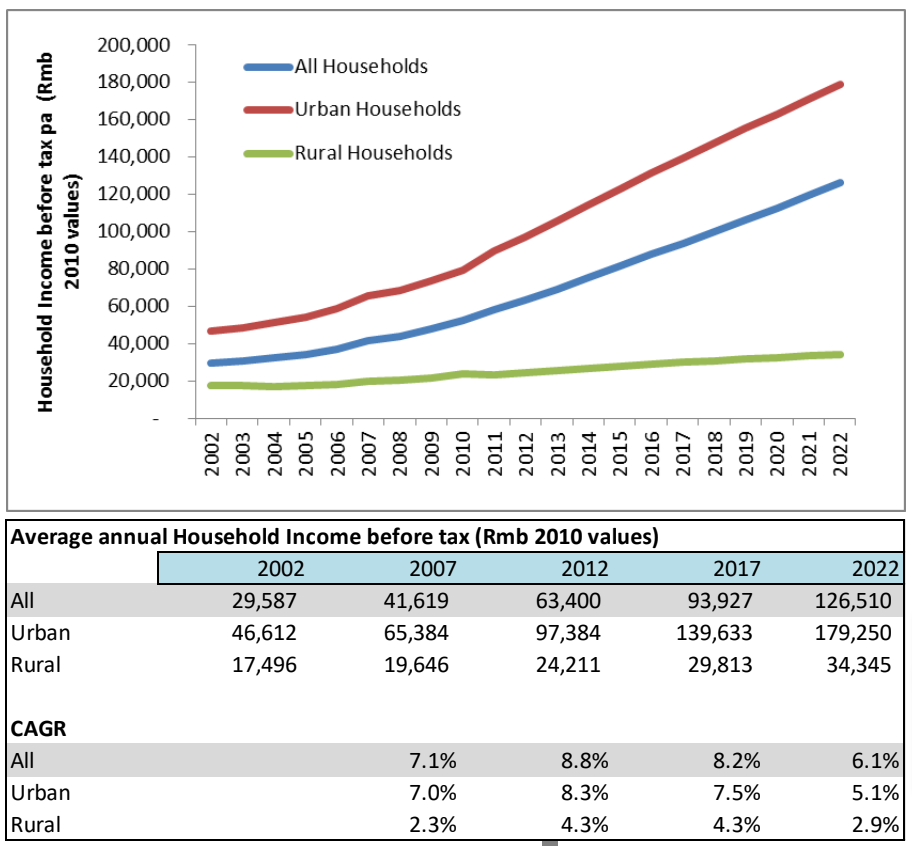
Implication for Average Household incomes
The Private Household Consumption Expenditure component of GDP divided by total number of households gives a strong measure of the average household’s expenditure. The Household Income and Expenditure Survey (done annual with a large sample) applied to this data point provides a good basis from which to then determine savings rates and distribution of income between urban and rural households and then also the distribution of households by income.
This chart shows the expected trend in average household income before tax as a result of projected real total GDP growth and Private Consumption share of it in future years. Average Urban income nearly doubles in the next decade.
The Current and Projected Distribution of Households by Income: All Households
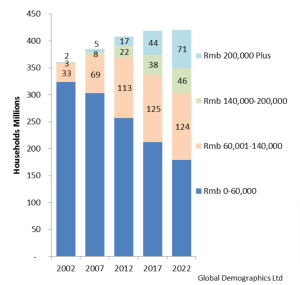
This shows the changing distribution of all households by Income segment from 2002 to 2022.
Note all financial data is in 2010 Rmb values (i.e. the effect of inflation is removed).
As is apparent from this chart all growth after 2012 is in terms of households with an income greater than Rmb 60,000 for the next 5 years and then the growth is in the segment of households with an income over Rmb 140,000 pa.
Between 2012 and 2002 this segment is projected to grow from 39 million households to 117 million households.
The Current and Projected Distribution of Households by Income: Urban Households
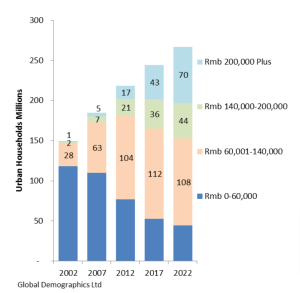
This shows the changing distribution of Urban households by Income segment from 2002 to 2022.
As is apparent from this chart the growth segment is over Rmb 140,000 pa. It grows from 38 million to 114 million households.
The income segments below that either show no growth or decline in absolute number.
This has important implications for market strategy. Any product or service aimed at urban households with an income below Rmb 140,000 is going to have no growth in its potential target market over the next decade. All revenue and profit growth in that sector will have to come from increased penetration or revenue per customer.
The Urbanization of Affluent Households
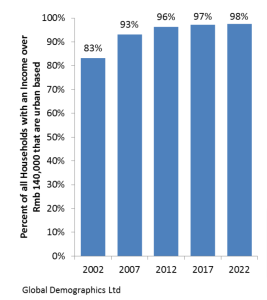
It is important to observe that nearly all affluent households (Rmb 140,000 and above) are urban based.
Initially (2002) this was less pronounced, but it has become very strongly urban by 2012 and is expected to continue to be so for the next decade.
The marketing implication of this is that any
product or service aimed at this segment (Rmb
140,000 plus in 2010 values) need only focus its
distribution on Urban areas. The additional cost of
reaching the small percentage of affluent
households in rural areas is probably not justified.
Income Segment Importance (Urban Households)
Finally in this section it is useful to consider the ‘economic’ importance of each of the income segments.
That is as compared to the importance in terms of number of households. As shown in the table below, the top two income segments (Rmb 140,000 plus) while in 2012 accounting for just 17.2% of all urban households, they nonetheless account for a very significant 35.7% of urban expenditure. By 2022 this is projected to have increased to 42.8% of households and 68.7% of expenditure.
Most important however, is the growth rate of market value. Segments below Rmb 140,000 show negative or only marginal grow in total value, the higher income segments show 8% and 17% growth pa.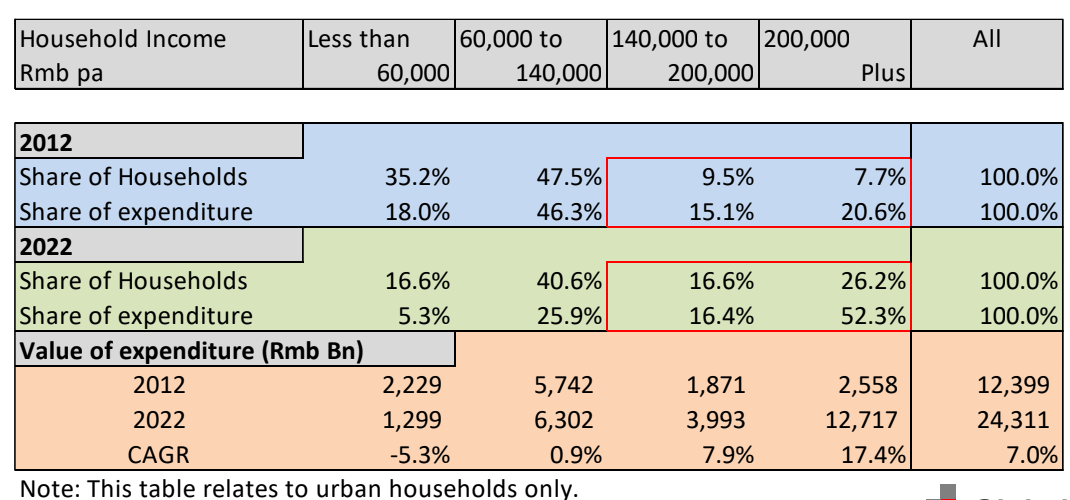
Key Issues
- Total real GDP growth rate will slow over the next decade as a result of an inevitable decline in the absolute size of the work force, combined with slower lift in productivity as a result of fewer new better educated
entrants and fewer rural urban migrants. - However, household incomes will not suffer the same decline. In fact household income growth will be sustained at the rate for the last 5 years through to 2017 and then slow. This is because an increasing share of the economy will go to consumers. This is a function of stated government policy as well as increased negotiating power of a declining number of workers.
- As a consequence it is expected that the average real (i.e. excluding inflation) urban household income will almost double over the next 10 years in real terms. Rural incomes will not grow as rapidly due to declining productivity of the remaining workforce in rural areas (older).
- As a result of increased urban income the distribution of households by income changes quite dramatically. Over the next decade all income segments under Rmb 100,000 will decline in share (and size), and the Rmb100,000 to 140,000 will be largely static. All growth in segment size (number of households) is for income groups above Rmb 140,000 pa (before tax).
- In addition, as a result of urbanization and the shift of the economy from agriculture to manufacturing and service sectors, 98% of households with incomes over Rmb 140,000 pa are urban based.
- Finally, the Rmb 140,000 plus segment is important not only because it is where the growth is, but also it is where the spending power is. At present while it is only 17.2% of all urban households it accounts for 35.7%
of all urban household expenditure. More importantly by 2022 this segment will be 42.8% of all urban households and 68.7% of all urban household expenditure. - In short, any product or service that is not positioning itself to meet the needs of this income group now is going to miss the opportunity in terms of growth in the consumer market of China over the next decade.
THE URBAN PROFILE: GIVEN THE AFFLUENT ARE CONCENTRATED IN URBAN AREAS IT IS USEFUL TO UNDERSTAND THE STRUCTURE OF THE URBAN AREAS
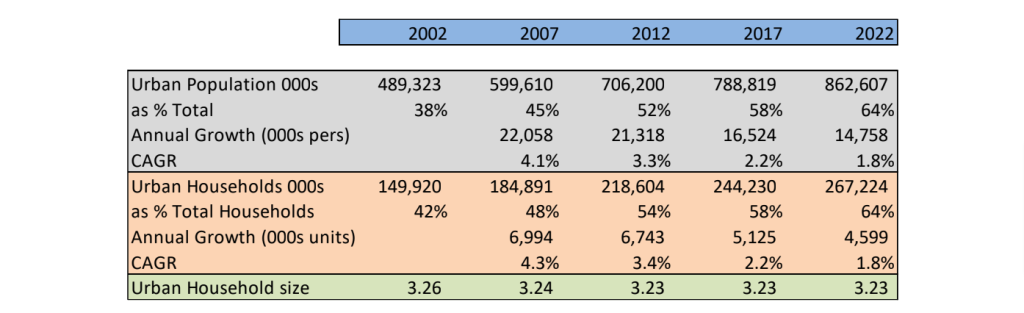
Trend in Urban Population and Households
In the last decade China added 21 million urban dwellers every year. This was a function of:
- Rural to urban migration within a province as well as from province to province migration (rural workers from the west moved to urban areas in east) for higher pay
- Urban areas having a greater share of births and lower death rate than rural as a result of the disparity in the age profiles of the two populations.
This trend is expected to continue – but at a slowing rate for the next decade, mainly as a result of significantly slower rural to urban migration as there are relatively few young persons left in rural areas and there is strong evidence that rural persons over 39 do not migrate for permanent urban residence.
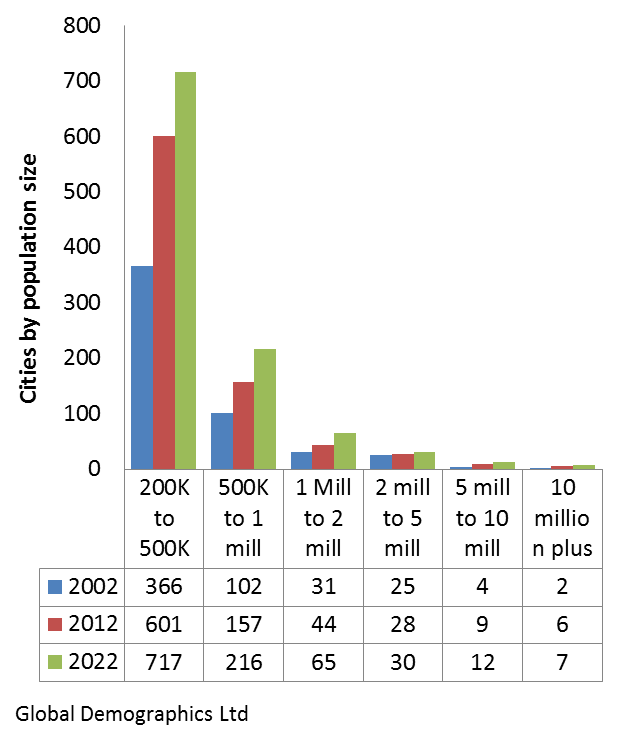
Cities by Size of Population
In 2012 there was a reported 845 counties (cities) with an urban population in excess of 200,000 persons.
Of these, the majority are with a population of less than half a million and the number of such urban areas will increase from 601 to 717 by 2022 given migration and population trends.
At the other extreme there are presently 15 cities with a population over 5 million and this is projected to increase to 19 by 2022.
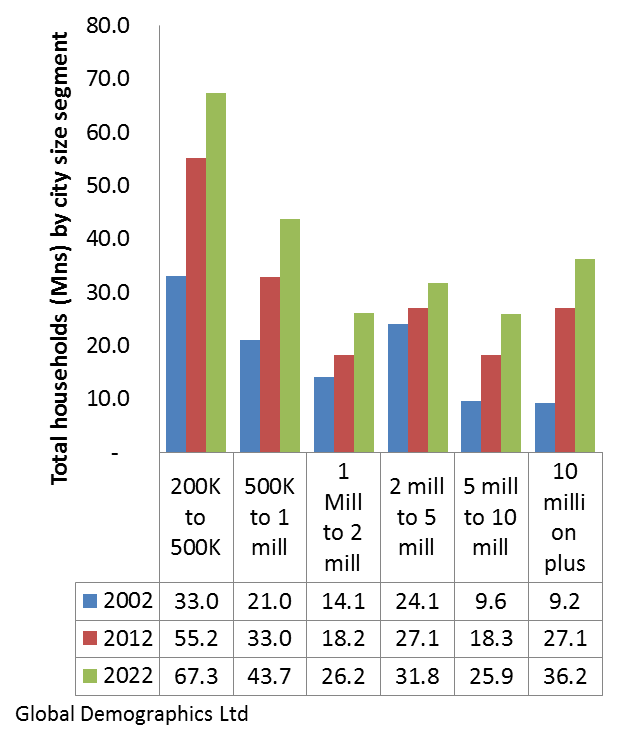
Number of Households by City Size segments
However, while there are relatively few urban areas with a population over 10 million, they none the less account for a very significant proportion of all urban households. In fact the very large cities are as important as the 1 to 2 million person cities in terms of total households in them.
The 15 urban areas with a population in excess of 5 million persons in 2012 account for 25% of all urban households in a city of more than 200,000 persons.
This means the large cities are important in terms of coverage of urban households.
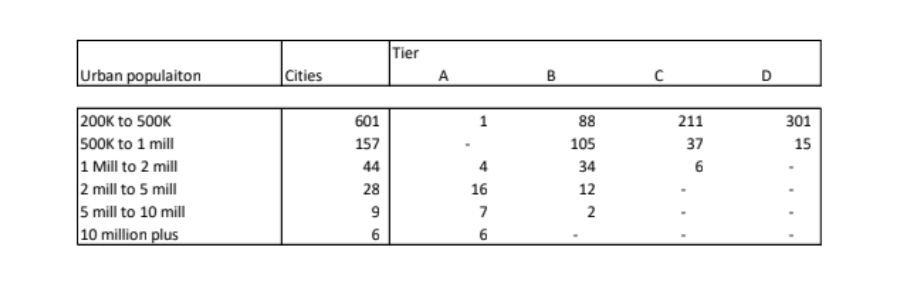
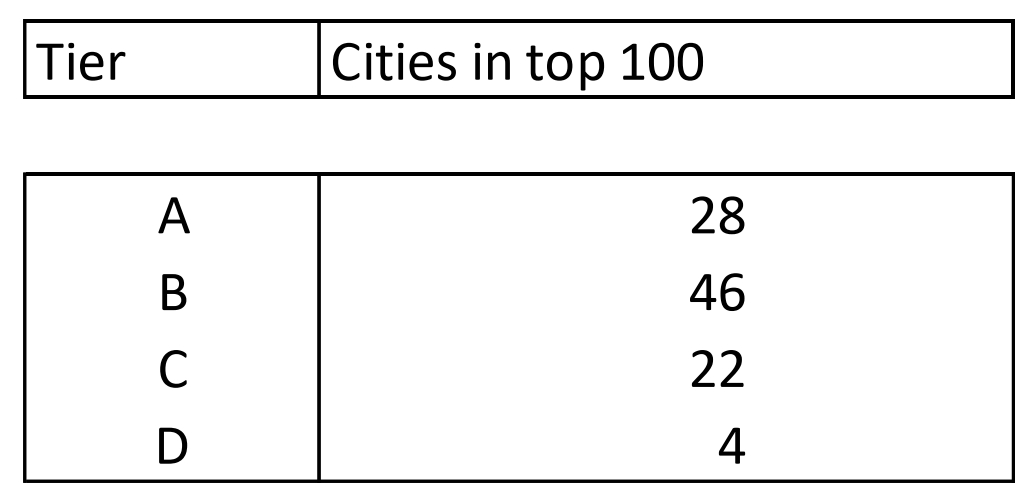
City by Class/Tier Classification
The Reader should also be aware that city ‘Class’ or ‘Tier’ is not a consistent indicator of city size or affluence and it is unwise to use it as a form of market opportunity classification. The classification takes into account the administrative role of the city. As such it is possible, for example, to have ‘A’ cities which are smaller (and/or less affluent) than ‘B’ level cities.
The table below shows the distribution of cities by class/tier by urban population size.
Key Issues
- The urban population of China will continue to grow, but at a slower rate than before and as a result of different forces. Increasingly rural to urban migration will decline in importance and this will be off set to some extent by the urban areas (with their younger populations compared to rural areas) accounting for an increasing proportion of births.
- As a result whereas 52% of the population (and 54% of households) are designated as urban in 2012, this increases to 64% for both by 2022. The growth rate for the next decade is nearly half that of the previous decade and three quarters in terms of number of persons.
- The focus on larger cities will continue. While there are relatively few large cities (15 with a population over 5 million persons out of a total of 845 urban areas with a population over 200,000 persons) they are nonetheless very important in terms of share of urban households. In 2012 they account for 25% of all urban households and this increases marginally to 26% by 2022.
- While ‘A’ level (Tier 1) cities are important it should be appreciated that the
classification of such cities reflects their administrative role and in fact there are many ‘B’ (Tier 2) cities which are larger and have more affluent households than a number of ‘A’ cities. It is not advisable to develop distribution strategies based on city tier classifications.
THE KEY CITIES FOR AFFLUENT HOUSEHOLDS WHERE TO FIND THE AFFLUENT (RMB 140,000 PLUS) HOUSEHOLD
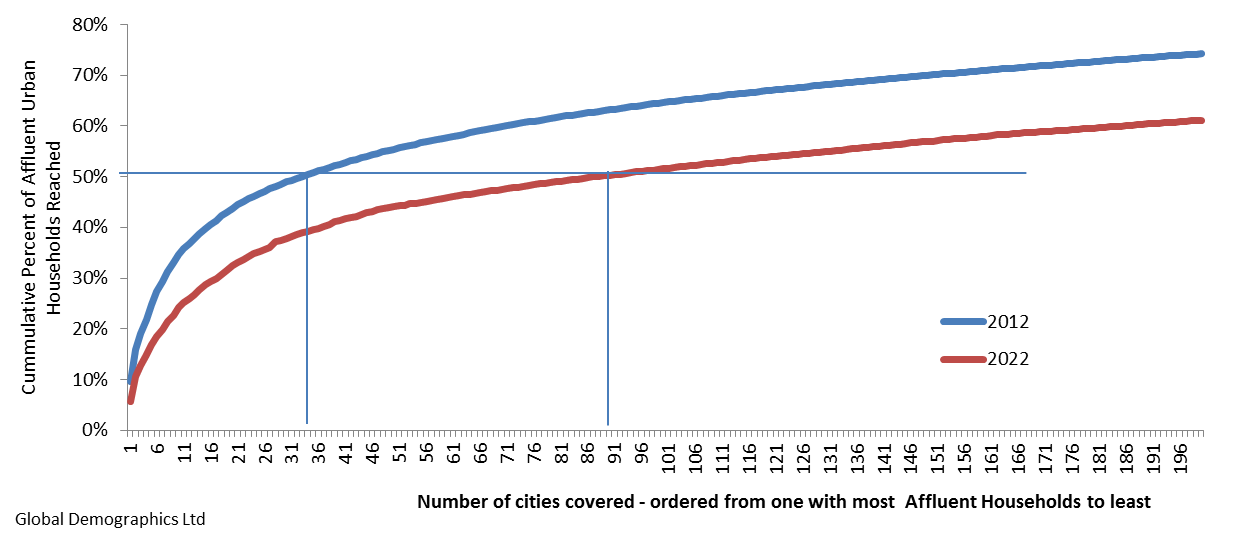
Cumulative reach of Affluent Households
This chart shows the cumulative reach of households with a before tax income of Rmb 140,000 in 2012 and 2022 as a brand moves out from the city with the greatest number of affluent households to the next largest etc.
In 2012, a brand only needed to be present in 33 of the 845 urban areas with more than 200,000 persons in them to reach 50% of the affluent urban households. As shown in this chart, after that point the marginal gain in terms of number of affluent households declines to relatively small numbers.
By 2022 however, it would need to be in 87 cities to have the same percentage cover.
Importance of different Reach levels
By 2022 this will have declined to 52% of affluent households and increased to account for 40% of all urban expenditure.
The issue with the second 100 cities is whether there are enough target
households in each city to be profitable. It ranges from 50,800 down to 27,900 affluent households. If a brand has 10% share of a category which 20% consume this means a customer base of 558 households.
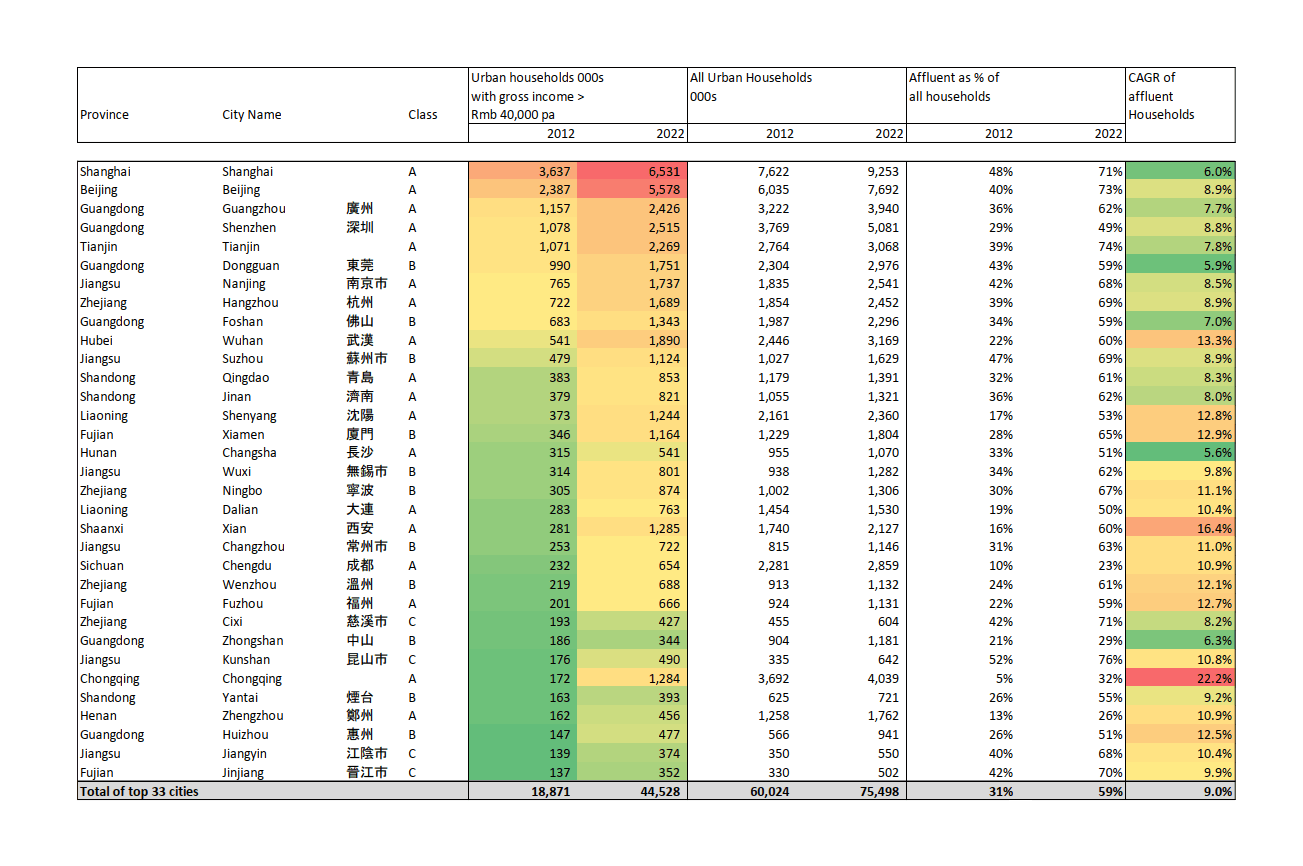
Top 33 cities in terms of number of Affluent Households
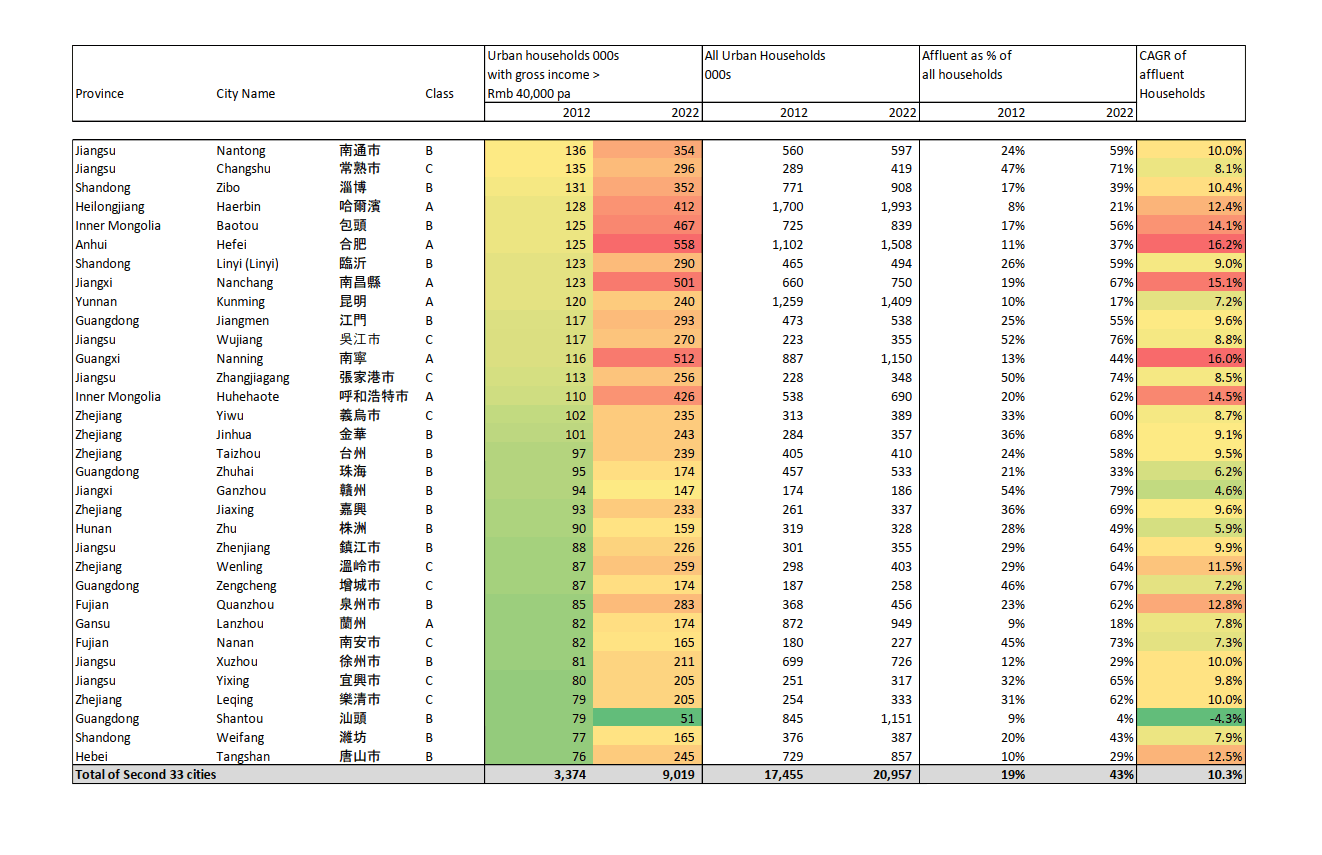
The second 33 cities in terms of number of Affluent Households
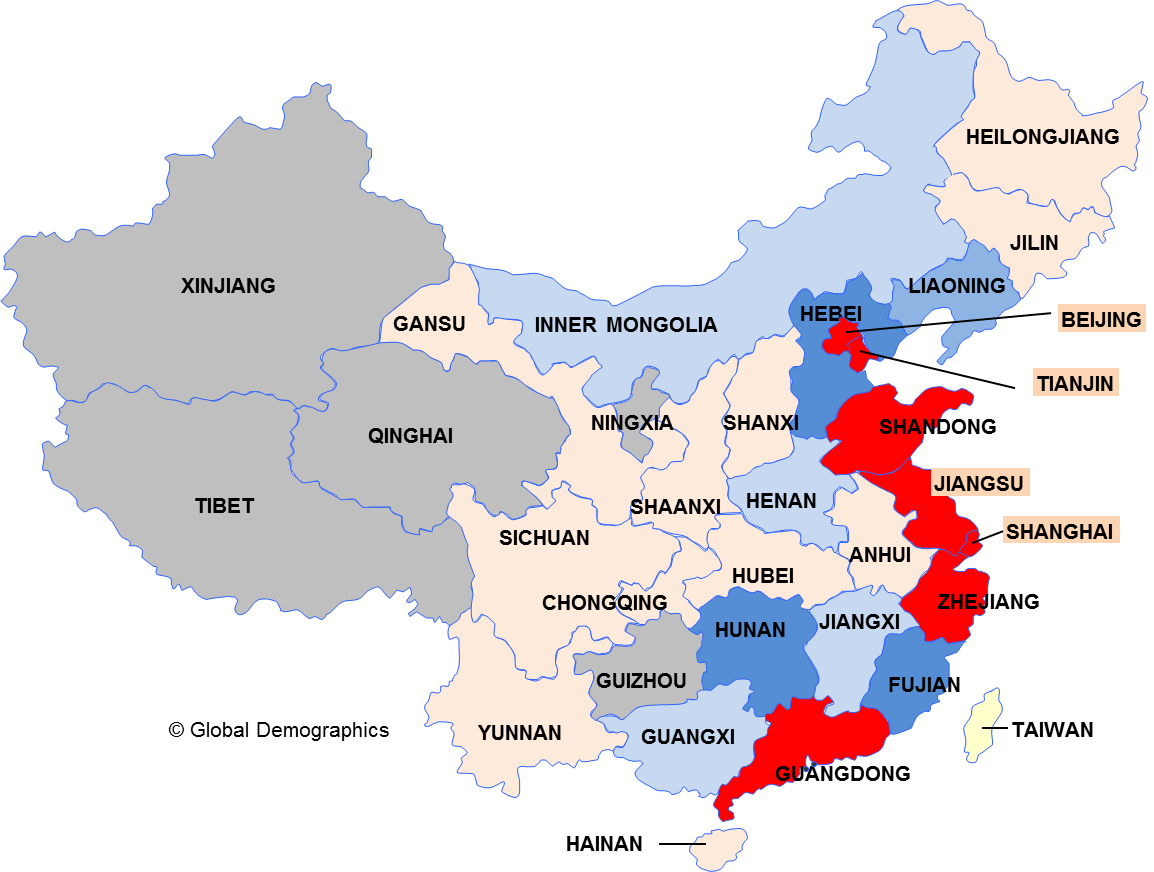
Tier Profile and Province Distribution of Key Cities
Those shaded the darker blue account for a further 17. In short, 79 of the top 100 cities are located in 8 of the 31 Provinces/Municipalities.
The Provinces shaded grey have no top 100 city in them.
Key Issues
- In order to reach 50% of all Affluent Urban Households (those earning over Rmb 140,000 pa before tax) it is necessary to have distribution in only 33 cities. Furthermore, 22 of these are in Jiangsu, Guangdong, Zhejiang, Fujian or Shandong Province. A further 4 are the Municipalities of Beijing, Shanghai, Tianjin and Chongqing. This means the required geographical coverage is quite narrow, limiting distribution costs.
- To maintain the same coverage in 2022 it is necessary that the brand expands distribution to 87 cities. However, again 55 are in the same key provinces plus the 4 Municipalities; Hebei, Hunan and Liaoning also become important.
- If a brand keeps in distribution in the original 33 cities then it nonetheless
would see its target market grow by 9% per annum and the spend value of the same growing by 12% per annum, such that it will be reaching 19% of all urban expenditure in 2012 and 31% in 2022. - If it expands out to include the next 33 cities then its reach would be 47% of affluent households and the total number of affluent households reached would grow from 18 million to 53 million. The expenditure value of such households would grow from Rmb 2.3 Bn to Rmb 8.3 Bn in ten years.
- So the key message is that focus with controlled expansion will result in significant growth of the target market (and perhaps revenue and profits) while keeping distribution and marketing costs under control.
Methodology
Our Database:
The source for the database is primarily the demographic and socio-economic data published by the State Statistical Bureau of China. It is ‘supported’ by data from other agencies such as the Ministry of Health as this helps check the consistency of the interpretation of the data. The Governments has done a census in 2000 and 2010 and by-census at regular intervals and we supplement that with information from inter year samples, annual labour force studies, annual household income expenditure surveys etc. By using multiple sources of data from different agencies within the same government we are able to develop a more complete picture of what the demographic and socio-economic landscape is like and the dynamics taking place within it.
To check on the overall voracity of the data from the government we also examine certain headline relationships, such as water consumption per capita, to ensure the reported levels of population etc. make sense. Similarly we look for consistency of relationships across countries of similar affluence and education levels and to the extent that there are differences the possible reasons are investigated.
The database is harmonized as much as possible to facilitate modelling and hence consistency of forecasting process.
necessary.
In the case of China we collect data down to County level (there are 2,236 of them for which data is available) and the modelling process is done at that level as well as at Province and National level. Obviously consistency is looked for, but where there is inconsistency the National solution is treated as the most reliable and the Province and County data is weighted so that the sum/average of them matches that of the National level data.
Forecasts Models
Model Process
The key drivers of the overall model are education and birth rates. Education is projected by using the current education profile of the adult population and then modifying that year by year taking into account the profile of those exiting the education system each year as well as the education profile of those who die each year.
An Education Index is then used to drive the projected trends in urbanisation, occupation profile, productivity per worker and household size. Time series trends drives birth rates, death rates and education enrolments.
The user is expected to use these forecasts as a base point – if the past relationships and trends continue then this is what will happen. That means they are a defensible base line – all changes can be related back to a past trend or relationship (and then ultimately source data) rather than the opinion of an individual.
In working form, the key projections are run to 2050 to see the long term impact of the projected trends. However, we only publish 20 years beyond latest actual, with confidence obviously being higher for 10 year forecasts.
The models
- Are proprietary to Global Demographics Ltd.
- Are based on our own comprehensive database.
- Use recognized statistical methods and processes – mainly econometric in style.
- Can be explained to users (not a ‘black box’).
- Are ‘constrained’ – meaning that they continuously check that different data items fit together.
- Are well tested and continuously improved as more data becomes available.
About Global Demographics Ltd
effort to ensure that its forecasts are based on sound and complete historical data sets and methodology.
The company produces country by country databases and market reports that cover 75 countries, spanning eight geographic regions as well as 32 States and 60 cities of India and 31 Provinces and 2,178 Counties/Cities of China. These databases are supplemented by a report series – covering all countries and regions. These report series cover, overall demographic and socio economic trends, income and expenditure patters,
The company is Headquartered in Hong Kong, Its subsidiary company, Global Demographics Healthcare Ltd, specializes in providing specialist disease incidence and health expenditure forecasting for the healthcare industry.

Copyright
The copyright of this document belongs to Global Demographics Ltd. The purchaser has the right to use this document and replicate it for use within the organisation that purchased it. The document may not be disclosed in full or in part to any third party in any form whatsoever without the express written permission of Global
Demographics Ltd. In particular it may not be posted on a public web site or made available through a web site in any form other than the purchasing company’s intranet.