

-
INTERACTIVE DEMOGRAPHICS
Create your own forecasts of the demographic future of a country
This statistical model enables you to modify the future values of one or more key variables (e.g., birth rates, propensity to be employed) and assess the impact of these changes on 75 other aspects of society through 2065.
You can run any number of scenarios and download them in Excel format.
Learn more or
Click here to log in, subscribe or access the free trial -
ONLINE DEMOGRAPHIC DATABASE
The Tables You Want … Instantly
Our underlying database encompasses 118 countries and comprises 87 key and 1,775 sub-series, as well as demographic and socioeconomic variables. Actual data is given for 2005 to 2023, and projected values (by Global Demographics Ltd) to 2065. Our online interface allows you to generate tables instantly for any number of selected variables. You can then download that table.
For more information and pricing click here
-
ARTICLES
Throughout the year, we produce several reports on timely and important demographic issues. These are free to read. To access them, click on ‘Articles’ in the main menu or click here.
The following are currently available.
Are declining total births a disaster for a country – The Japan Scenario
The projected growth and location of affluent households in China
-
BOOKS
2045 – Global Demographic Trends
A comprehensive examination of what the demographic and socioeconomic profile of different regions of the world might be expected to look like by 2045.
China, with 1.4 billion people and a large and growing economy, is changing as it grows older and more affluent. This book examines what China might look like by 2045 and the market opportunities that may emerge.
-
INTERACTIVE DEMOGRAPHICS
Create your own forecasts
This is a statistical model that allows you to change one or a number of key variables affecting a country's future demographics and socio-economic profile (for example, birth rates and propensity to be employed) and see the impact of those changes on 75 other aspects of society through 2065.
Try it for free.Learn more and Click here to log in, subscribe or access free trial
-
ONLINE DEMOGRAPHIC DATABASE
The Tables You Want ... Instantly
As for Interden above - add click here to take them to the login subscribe page
For any country or group of countries generate a table for a variable(s) for years (from 2005 to 2045) you want the data. Download and use in your own models/reports.
-
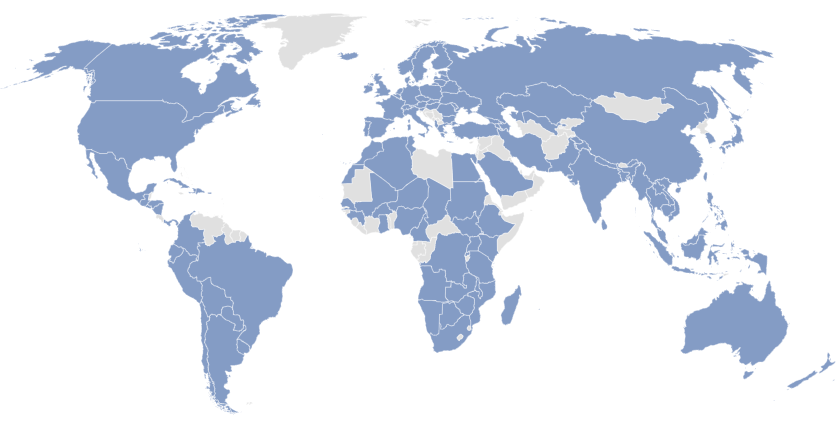
COUNTRIES COVERED
We cover 117 countries – click here for a full list
As shown,they include most regions of the world.
-
CHINA REGIONS COVERED
31 Provinces, 256 Prefectures and 1,400 Counties
Urban and rural populations are detailed separately in the Online Database.
Currently, the interactive model considers the total population for each county, Prefecture, and Province.
However, the urban-rural split is included at the National Level.
-
DATA COVERAGE
There is a total of 77 key variable sets and a further 2400 subsets (for example, age by 5 yr steps)
They cover Total Population, Births, Deaths, Migration, age profile, number of households, household size, Education, working age and employment by gender and age, productivity, total GDP, proportion paid in wages, household incomes and household expenditure by income segment. The web page ‘Variable Definitions details the nature of each.
-
TIME RANGE
All data series have ‘actual’ data from 2005 to 2023/24, and forecasts and modelling are to 2065.
However, Global Demographics Ltd’s underlying database has data series from 1994, and where appropriate, the more extended series are used to develop forecasting models.
-
DEFINITIONS AND METHODOLOGY to VARIABLES DEFINITIONS & METHODOLOGY
There is a total of 77 key variable sets and a total of 2649 series. They cover population, age profile, Education, Housing, Births, Deaths, employment, Economy, Household Income and expenditure. Click here for details and definitions.
All historical data is sourced from the UN and World Bank. Forecasts use Global Demographics proprietary algorithms and statistical models. -
TIME RANGE
All data series have actual data from 2005 to 2022/23 and forecasts and modelling is to 2065.