China Cities – Demographic Profile and Forecasts
Province Capitals or Special Economic Zones (34) and Prefecture Capitals (250)
Demographics influence consumption – so understanding the changing pattern of the demographics of a city provides good insights into the absolute value of the consumer market and how consumption patterns might change over time.
This report gives you a logical analytical basis for the amount of, and projected trend in, consumer expenditure for each city by income segment.
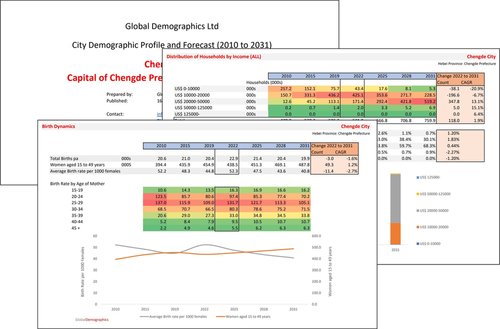
Each page contains a table showing the core data for the selected years and also a chart of that same data so trends can be easily seen.

This report series is structured in the same format for all countries and regions and is as follows:
- City synopsis
- City rank on key variables
- Projected growth rates of key variables
- Table of Contents
- Population Dynamics
- Population Age Profile
- Birth Dynamics
- Death Dynamics
- Housing
- Education
- Employment
- Productivity
- GDP
- Household Incomes (Real US$ 2018 values)
- Distribution of Households by Income (ALL)
- Distribution of Households by Income (Urban households)
- Propensity to spend by Category by Income Segment (Urban Households)
- Amount (US$) spent by Category by Income Segment (Urban Households)
- Income Segment’s share of total urban household Expenditure
- Healthcare Expenditure (Real US$ 2018 values)
- Healthiness of the Country
- Copyright
- Methodology
Expenditure Categories used are:
Food and Non-alcoholic beverages; Tobacco and Alcohol; Clothing and footwear; Residence (mortgage/rent/utilities/rates etc.); Household operations including daily use items; Health; Transport; Communications; Recreation; Education; Personal Care and Other general expenditure.
Gross Household Income breaks used are:
0 – US$10,000 – US$20,000 – US$50,000 – US$125,000 – Plus
EXAMPLE REPORT
Click below for our example report. The same format and data is available for all regions and cities.
PURCHASING
All payments are securely processed by Stripe (any credit or debit card). We are fully PCI compliant to the highest standard of Level 1. Our website operates full SSL encryption. No card data is obtained or held by our site.
PRICING
Price is US$7 per China City.
FORMAT
The reports are published in pdf format – and are consistent in structure and layout. An example of one such report can be downloaded/viewed by clicking on the button above labelled ‘Example Report’


