Twelve steps from opening the model to downloading a finished scenario. Most people are running
their first one inside five minutes — the rest of this page is here for when you want to do something
specific. Click any screenshot to enlarge it.
Before you start
Three things that make the rest obvious.
Almost every question we get about the model comes down to one of these. Two minutes here saves a lot of
hunting later.
Display is not calculation
Choosing fewer topics, tables or years changes
only what is on your screen. The model always solves every variable for every year from 2005 to 2065. You
can never leave something out by accident.
There are three tables, always
Base is our forecast and
never moves. Revised is your scenario. Difference is one minus the other.
If your changes seem to have done nothing, you are almost certainly looking at Base.
Only 14 variables are yours
The other 68 are calculated from them. You
cannot type over next year’s fifteen-year-olds, because they are already determined by births fifteen
years ago. That is a feature: it is what keeps a scenario internally consistent.
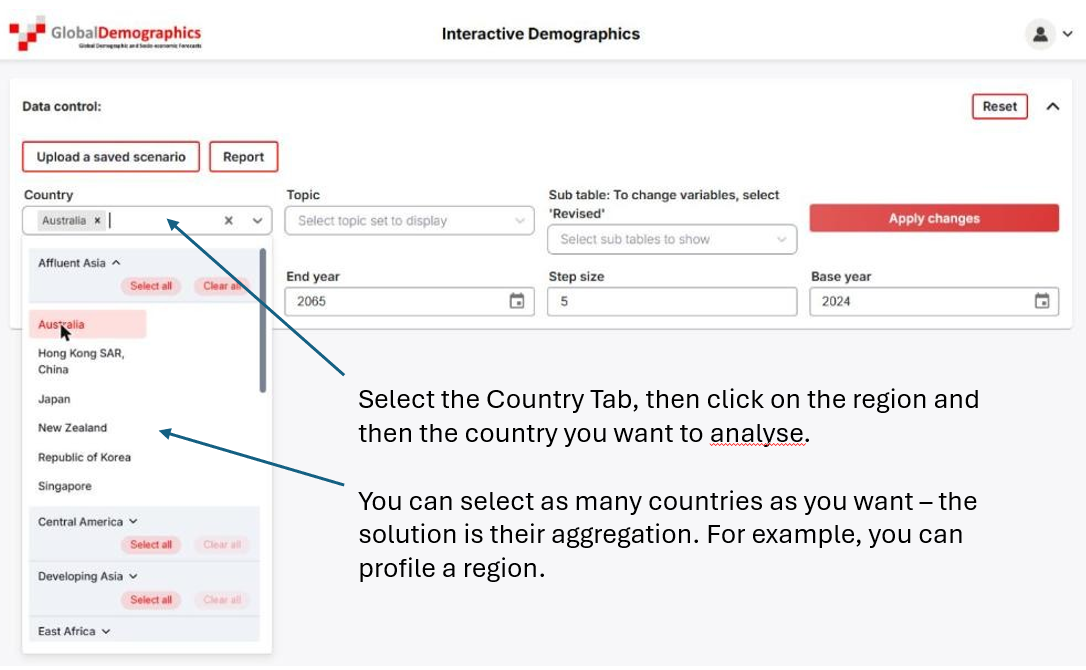
Start by picking what you want to model. You can select a single country, or tick several and have the program
add them together: select every Western European country and the tables come back as one combined Western
Europe — one population, one workforce, one economy.
02
Choose the topics and tables to display
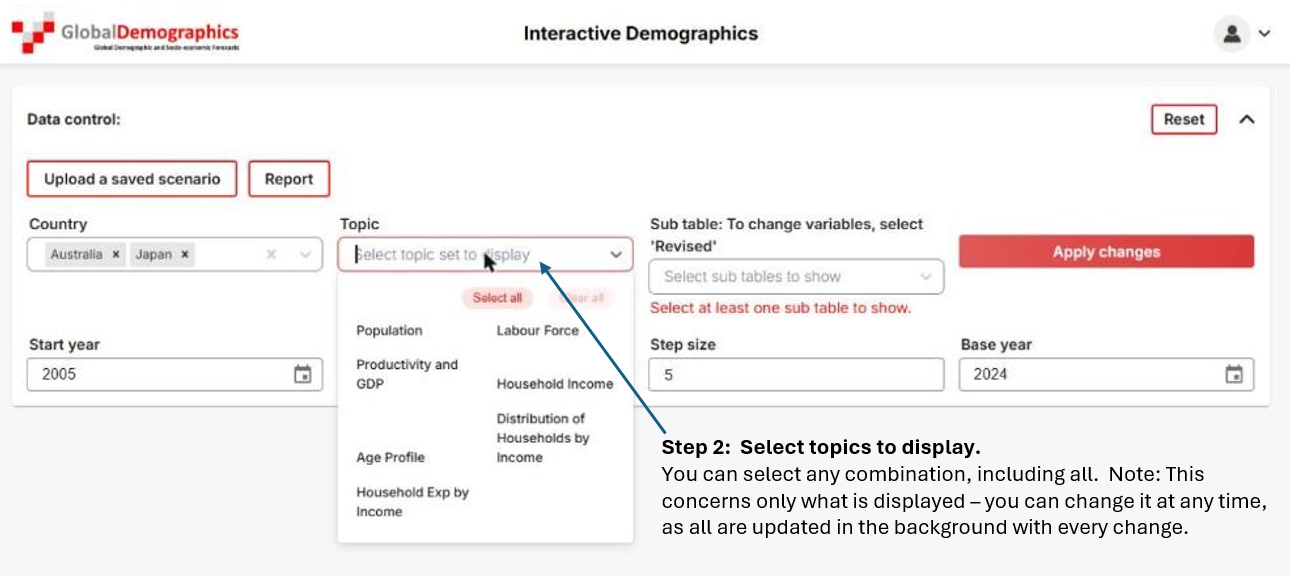
Next, decide what appears on screen. This is presentation only: whatever you choose to display, the model still
solves every variable for every year behind the scenes. You are picking a window, not restricting the
calculation.
The topics
Population
Labour Force
Productivity and GDP
Household Income
Age Profile
Distribution of Households by Income Group — using segments you define
You must have at least one topic showing, and you can have as many as you like. The last one works for a single
country only — not on an aggregate.
Tip
Show one or two topics at a time. Everything can be on screen at once if you want it, but you will spend the
session scrolling. Close a topic and reopen it later — nothing is lost.
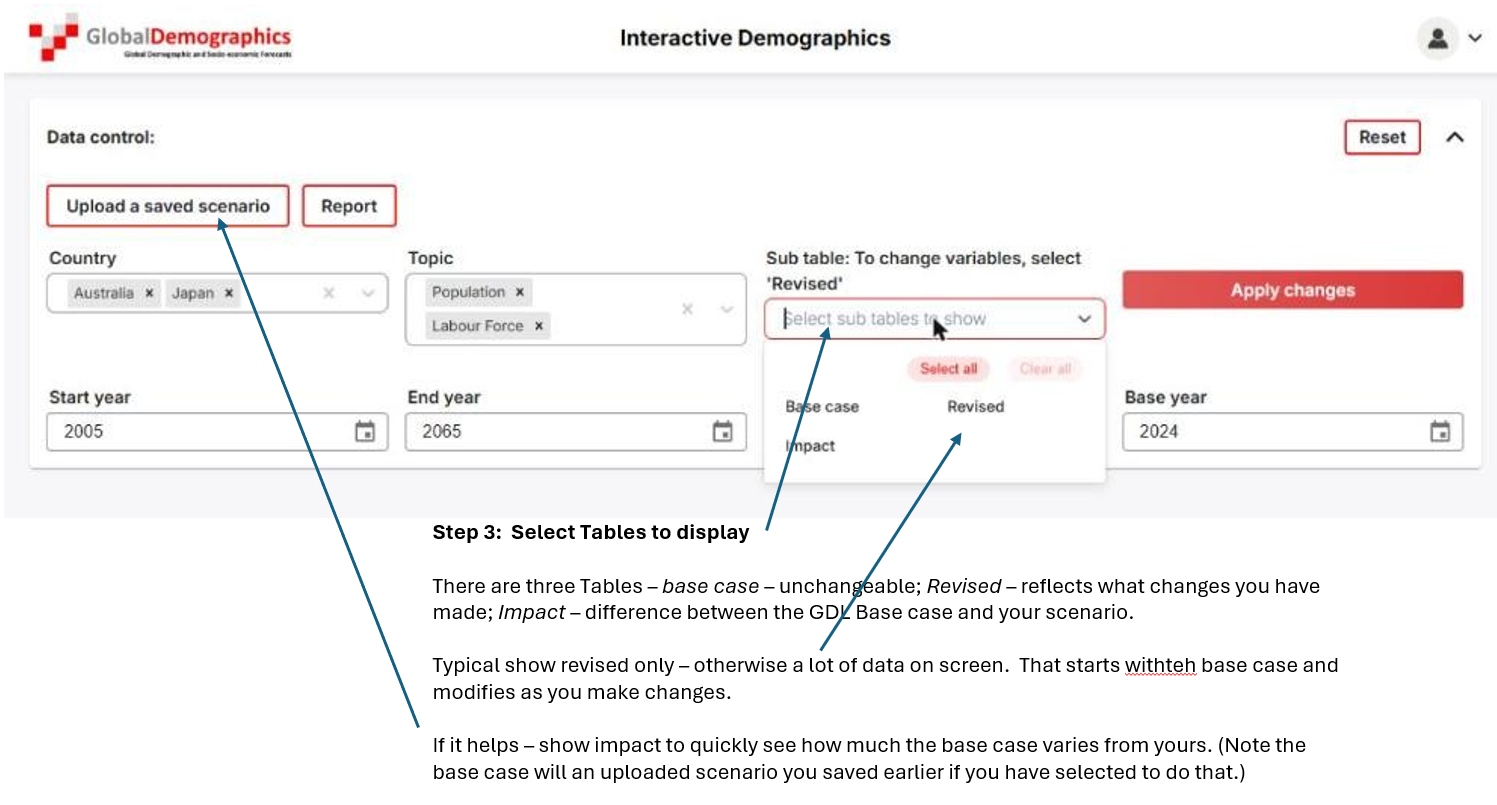
The three sub-tables
For every topic you can show any combination of three tables. The choice applies to all topics at once, and you
can change it whenever you like.
Table
What it shows
Base case
Our forecast, unchanged. Your fixed reference point.
Revised case
Your scenario. Also the table that carries the tooltips explaining
each variable, and the one you need on screen to view trend charts.
Difference
Revised minus Base — the size and direction of the change you
have made.
Tip
Best to use Revised only, and select the others only when you need to compare results —
this minimises scrolling.
03
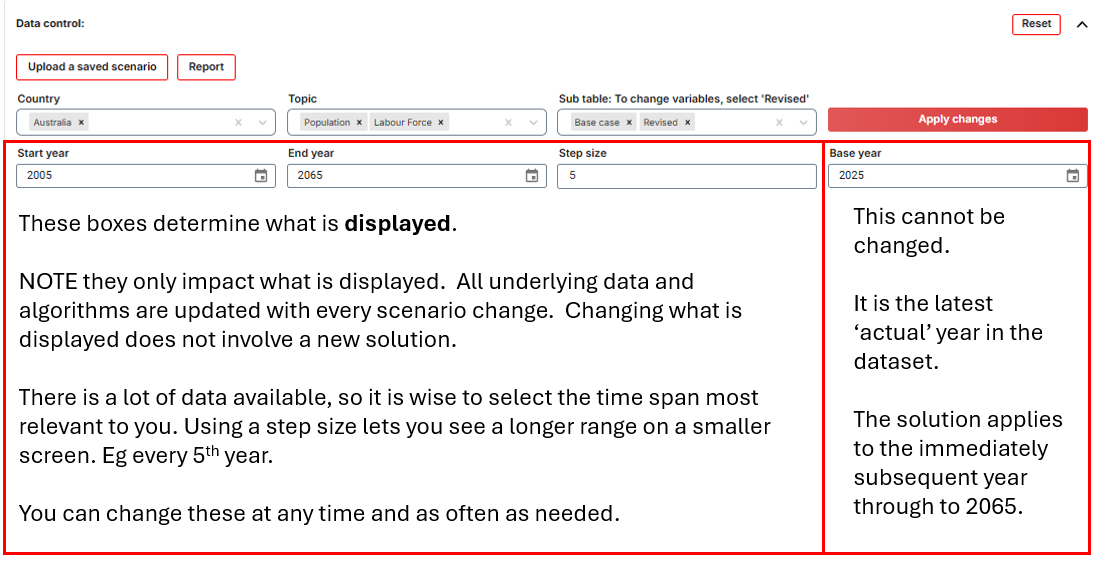
Choose the years to display
The model covers 2005 to 2065 — actual data to 2024, forecast from 2025 onward. That is around sixty
columns, far more than fits on a screen, so you choose which years to show. Again, this is display only: the
model solves every year regardless.
Step size
Rather than tick years one at a time, set a step size and the program shows every nth year relative to
your base year. With 2025 as base and a step size of 5 you get 2010, 2015, 2020, 2025, 2030 and so on — a
readable, evenly spaced view of a sixty-year run.
Base year
This cannot be changed. It is the latest actual year — you cannot change that year, or any earlier year’s
data.
Tip
Step size also controls the table you get when you go to change a variable (step 7), which is where it really
earns its keep. A step size of 5 means entering five or six numbers instead of forty.
04
Apply your changes
Nothing loads until you tell it to. Click the red button at the top right of the menu screen to pull in the data
for your chosen countries and display it to your chosen specification. The button then changes its own label
depending on what it is about to do.
If it reads
Clicking it will
Applying Changes
Load the data for the countries you have selected, and display it.
Update Data Display
Redraw the screen only — because all you changed was a display setting such as
the year range. Your loaded data and any scenario stay exactly as they are.
Part two
Understand what you are looking at
05
Variables you cannot change — and why
Most of the 82 variables are outcomes, not inputs. You will know them because the button beside them in the
Revised table is labelled as non-changeable.
Take the 15–24 age group. Next year’s figure is this year’s, plus the fourteen-year-olds moving
up, minus the twenty-four-year-olds moving out, adjusted for the age profile of migrants and for deaths. There is
no sensible way to type a different number over it — and if you did, the rest of the model would no longer
add up. The program does that arithmetic for you.
A useful way to think about it
The non-changeable variables are the ones a politician could not arbitrarily change. The changeable ones are
the levers that policy, investment and social change genuinely pull.
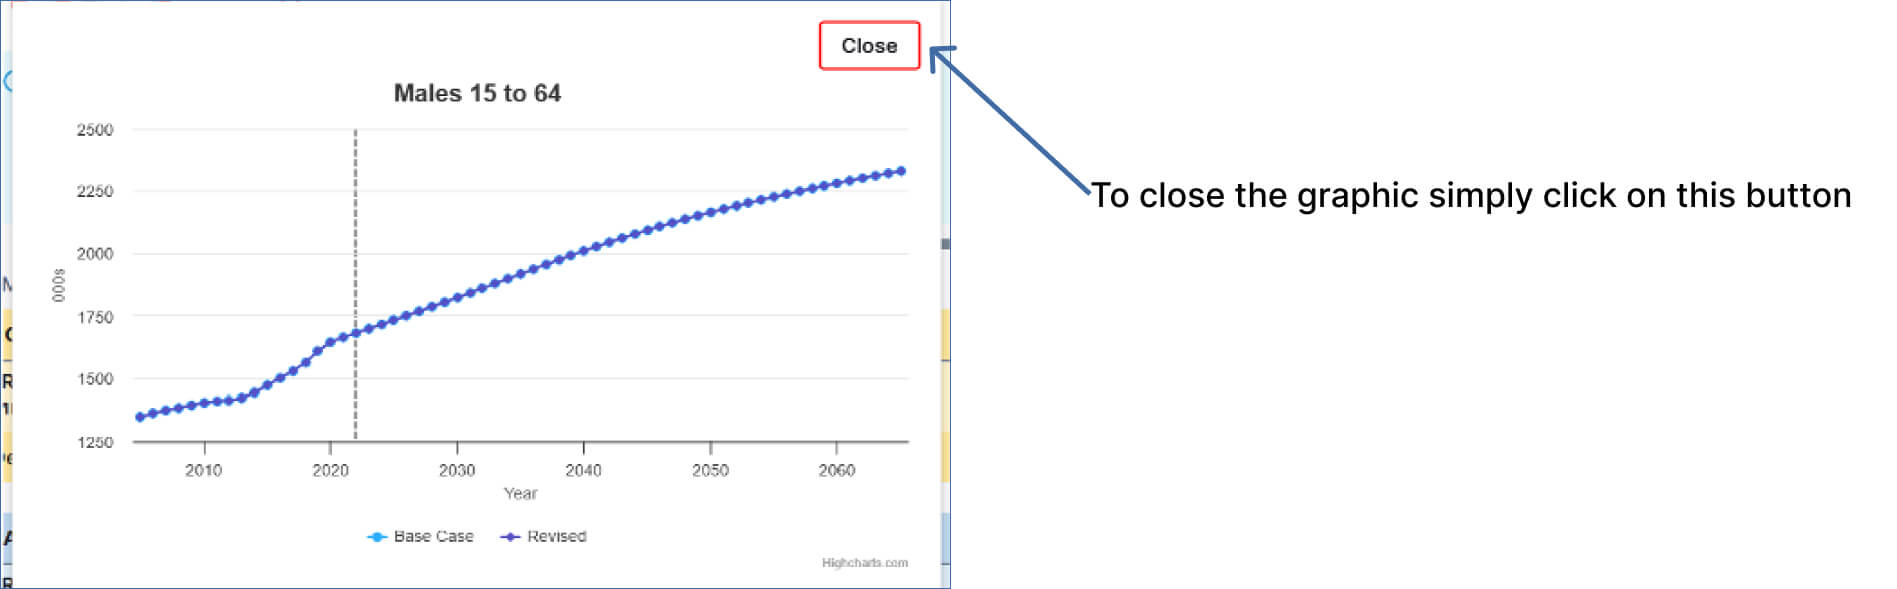
They are not dead ends, though. Click the button beside any of them and you get a chart of that variable across
the full run, so you can see the shape of what your scenario has produced.
Identifying a non-changeable variableThe trend chart for a derived variable
06
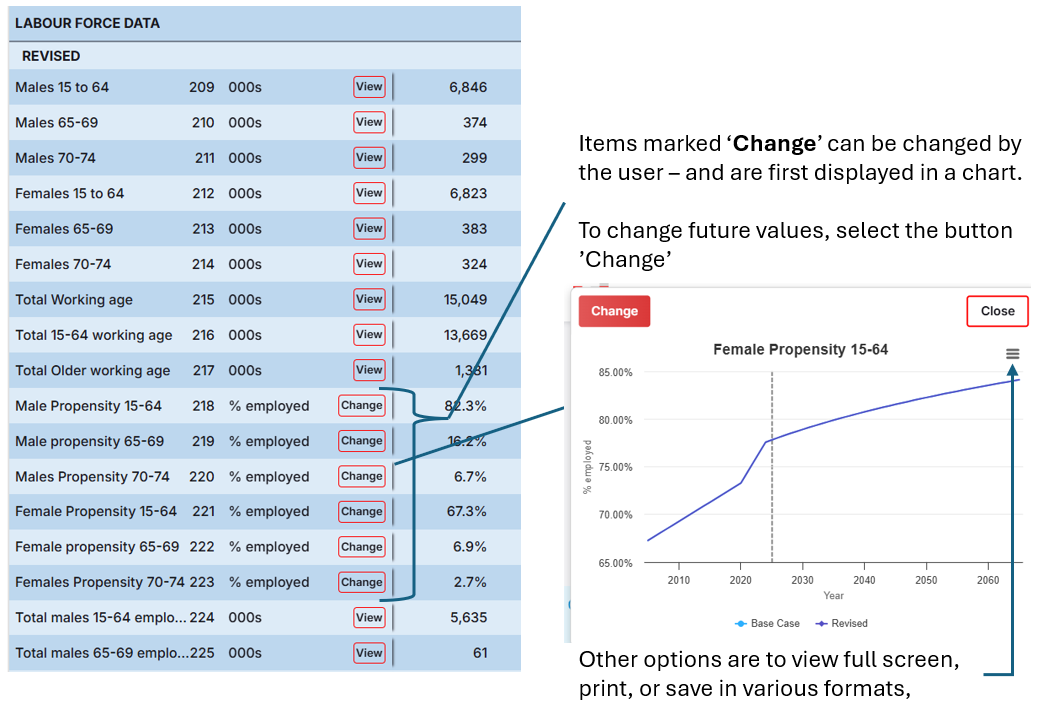
Variables you can change
The rest — fourteen of them — carry a change button. These are the levers:
Birth rate
Migration rate
Propensity for age group to be employed by gender
Males 15 to 64 yrs
Males 65 to 69 yrs
Males 70 to 74 yrs
Females 15 to 64 yrs
Females 65 to 69 yrs
Females 70 to 74 yrs
Percent of previous year’s GDP invested in Fixed Capital
Growth rate of Gross domestic product per worker, that is productivity
Growth rate of Total Gross domestic product
Wage ratio — the share of productivity that reaches the worker
Propensity of households to spend
Median income as a percentage of average income — the disparity of income distribution
One limit
You can only change future years — currently 2026 onward. History is history.
Clicking the change button opens a chart of that variable from 2005 to 2065. If you have already made changes,
both the base case and your revised case are drawn together, so you can see at a glance how far you have moved
it.
Part three
Build and run a scenario
07
Enter your new values
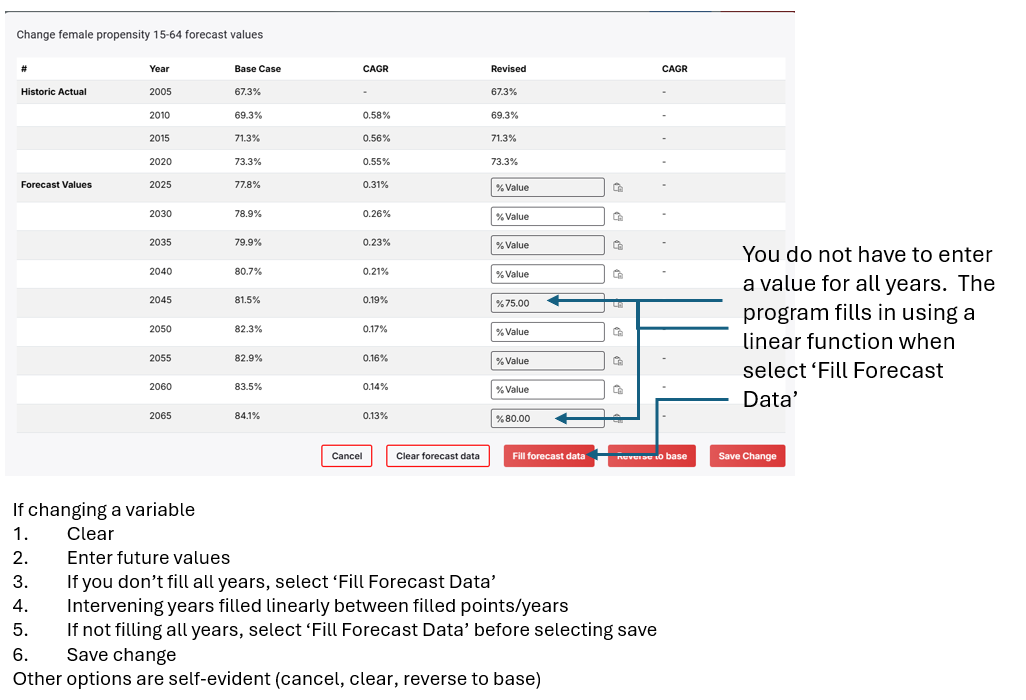
Click Change at the top left of the chart and a small table opens, showing only the years you chose to display
— so your ‘step size’ setting from step 3 decides how much typing you are about to do. It arrives pre-filled
with the existing forecast.
To do it
Optionally click Clear to empty the existing values.
Type your new values into whichever years you want to set. You do not need to fill in every one.
Click Fill Forecast Data.
That last step is what makes this quick. The program fills every intervening year by drawing a straight line
between the values you did enter. Set 2030 and 2050, and the twenty years between them are interpolated for
you.
08
Check it, then save or discard
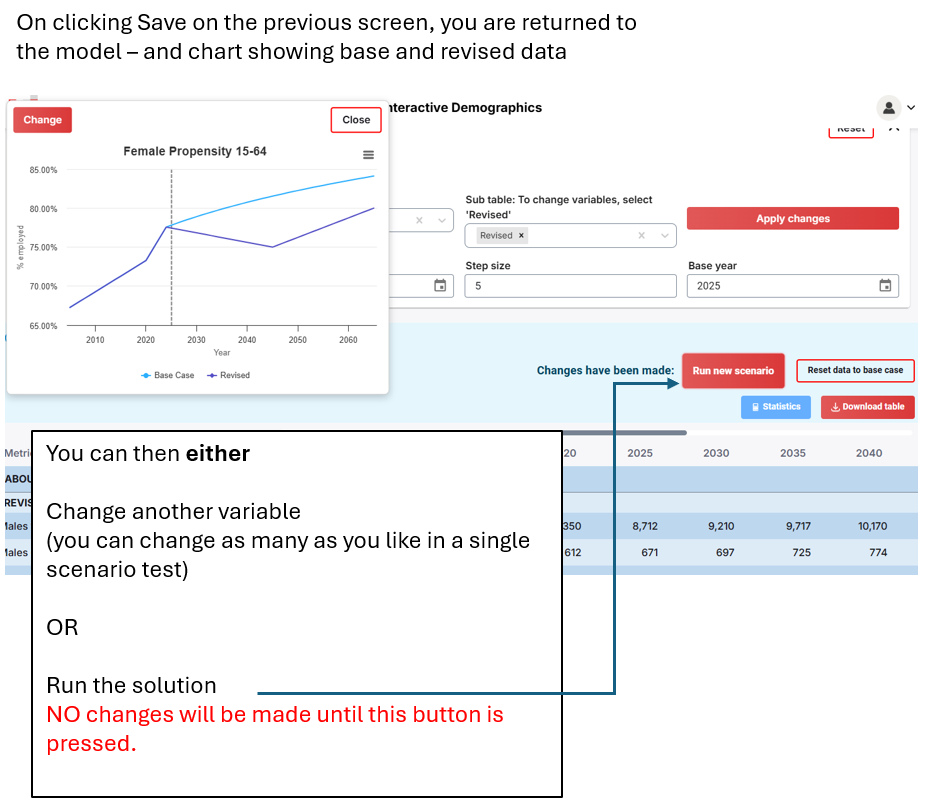
After clicking Save Change, you are returned to the chart for the variable, which now
displays both the old/original data and the new values you just entered for it. If the line looks wrong, it
probably is — fix it here rather than after running the scenario. Your other options are Cancel or Clear,
as described below.
Three options sit at the foot of the table:
Option
Result
Cancel
Nothing is changed. You go back to the main screen.
Clear
Empties the forecast values so you can enter a different set.
Save change
Writes your new values into the underlying database ready for
modelling. Nothing is recalculated yet — that is step 9.
09
Run the scenario
Click Run New Scenario at the top right of the tables. Every table recalculates using your new values. It is normally
very quick.
If nothing appears to happen
Check that Revised is ticked in the data control box. The Base table does not change —
that is the whole point of it — so if Base is the only table on screen, a successful scenario looks
identical to no scenario at all.
Changes accumulate
You do not have to do everything at once. Change one variable, run it, look at the result, then change a second
variable and run again — the first change is still in place, so you are watching the combined effect build
up. That works across sessions too.
Tip
To isolate the effect of a single variable, run it, download the result (step 11), then reset to base (step 10)
before testing the next one. To build a compound story instead, just keep going.
Part four
Reset, export and refine
10
Reset to the base case
Click Reset Data to Base Case at the top of the tables and everything — both the Base and the Revised tables — goes
back to our original forecast.
This cannot be undone
Resetting discards the scenario you have built. If it is worth keeping, download it first.
11
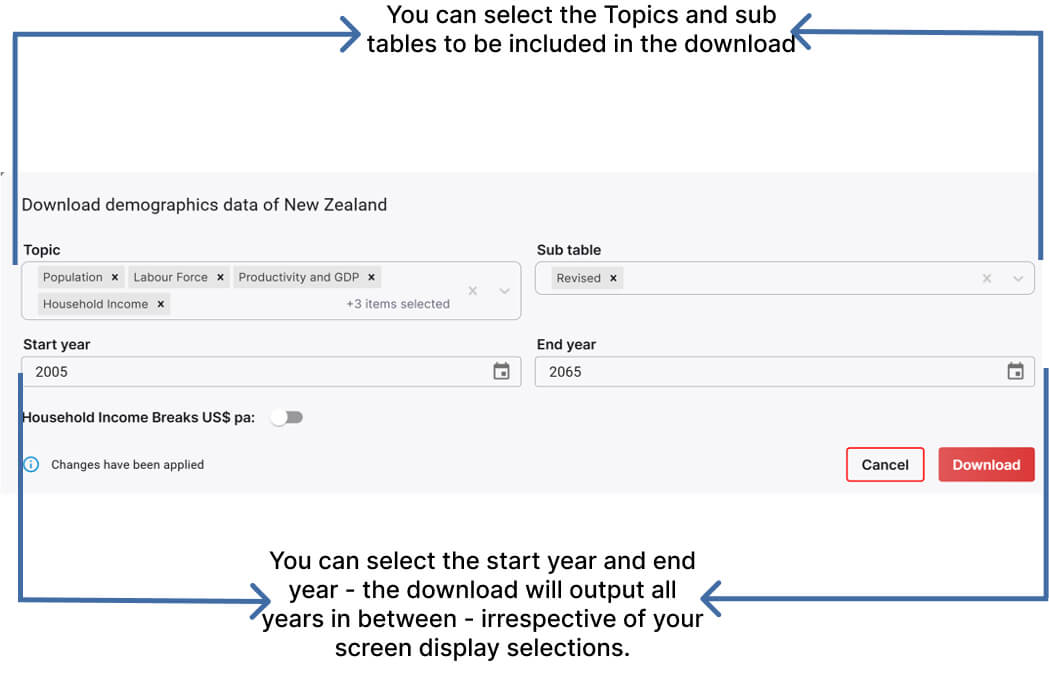
Download to Excel
At any point you can download what you are looking at as an .xlsx file — before running a
scenario, after running one, or several times through a session.
Tip
Downloading is also how you keep more than one scenario. The model holds a single revised case at a time, so to
compare three futures side by side, run each, download it, and assemble them in Excel.
Downloading the results
12
Set your income segment breakpoints
The last two topics — Distribution of Households by Income Segment, and Household Expenditure by Income
Segment — divide households into five income groups. You decide where the lines fall. Select either topic
in the data control area and a slider appears.
To do it
Move the slider to on.
Use the + sign to enter a breakpoint for each of the four lower income segments. The fifth
segment is everything above the highest breakpoint.
Or leave it off, and the program sets the breakpoints itself around average household income.
Why it matters
Set your breakpoints at levels that mean something for your business — the income at which households
start buying what you sell — and the model will tell you how many households cross that line each year
between now and 2065.
Reference
Which variables can I change?
Variable
Topic
What changing it does
Birth rate (per 000 women 15–49)
Population
Drives total births, and through them the whole age structure, workforce and household count from that year on.
Migration rate (% of population)
Population
Adds or removes people at a given age profile — so it moves births, workers and households, not just headcount.
Male propensity 15–64
Labour Force
Share of prime-age men in work. Typically 70–90%.
Male propensity 65–69
Labour Force
Typically a low percentage (15%–40%).
Male propensity 70–74
Labour Force
Always low, around 10% at best.
Female propensity 15–64
Labour Force
Share of prime-age women in work — usually the largest untapped labour reserve.
Female propensity 65–69
Labour Force
Typically a low percentage (15%–40%).
Female propensity 70–74
Labour Force
Always low, around 10% at best.
Share of previous year’s GDP invested in Fixed Capital
Resources per worker
Gives a measure of fixed resources behind each worker.
Growth rate of GDP per worker
Productivity
Your expected trend in productivity per worker. Default is the latest actual year, halving in value over 40 years.
Growth rate of Total GDP
Productivity
Your expected growth rate per annum for the total economy. Note that it retroactively changes GDP per worker to fit.
Wage ratio
Household Income
The share of output per worker that reaches the worker — the link between economy and household.
Household expenditure as % of income
Household Income
The savings-versus-spending decision; drives total consumer expenditure and PCE.
Median as % of average income
Households by Income
Income disparity. Lower means a longer tail and fewer households near the average.
Income segment breakpoints
Households by Income
The four cut-offs defining five income groups, and the number and percent of households in each.
The Base table never changes — that is what makes it useful as a reference. Tick Revised in the data control box, or better, tick Difference, which shows only what moved.
Can I model more than one country at once?
Yes. Tick as many as you like and the model aggregates them into a single set of tables. The two income-segment topics are the exception — those work for one country at a time.
Why can’t I change the number of 20-year-olds?
Because it is already determined: it is the births of twenty years ago, adjusted for migration and mortality. Change the birth rate or the migration rate instead, and the model works it through for you.
Do I have to fill in every future year when changing a variable?
No. Enter values for the years you care about, click Fill Forecast Data, and the program interpolates a straight line between them. Setting your step size first (step 3) makes this much faster.
How do I compare two different scenarios?
The model holds one revised case at a time, so run the first, download it, reset to base, then run the second. Compare the two spreadsheets side by side.
Can I change history?
No — only years from 2024 onward. Data to 2023 is actual, sourced from the United Nations and the World Bank.
What currency are the financial figures in?
Real 2023 US dollars, converted at 2023 exchange rates, so countries and years are directly comparable without any adjustment.
Still stuck?
Email info@globaldemographics.com
and tell us the country and the variable you were working with — it is usually a quick answer.
Next
Ready to build a scenario?
If you have not yet seen what the model covers — 109 countries, plus China national and national urban,
82 variables to 2065 — start there.