Interactive Demographics · What it covers

Create your own future demographic scenarios — in seconds.

Demographics shape a country’s future more than almost anything else, and only a handful of factors drive them. Change one of those factors here and watch all 82 variables re-solve across population, workforce, output, incomes and spending — every year out to 2065.

Start the free trial Read the 12-step manual
109Countries
31Chinese provinces
82Variables modelled
14You control
2065Forecast horizon
How the model works

One system of linked equations, calibrated country by country.

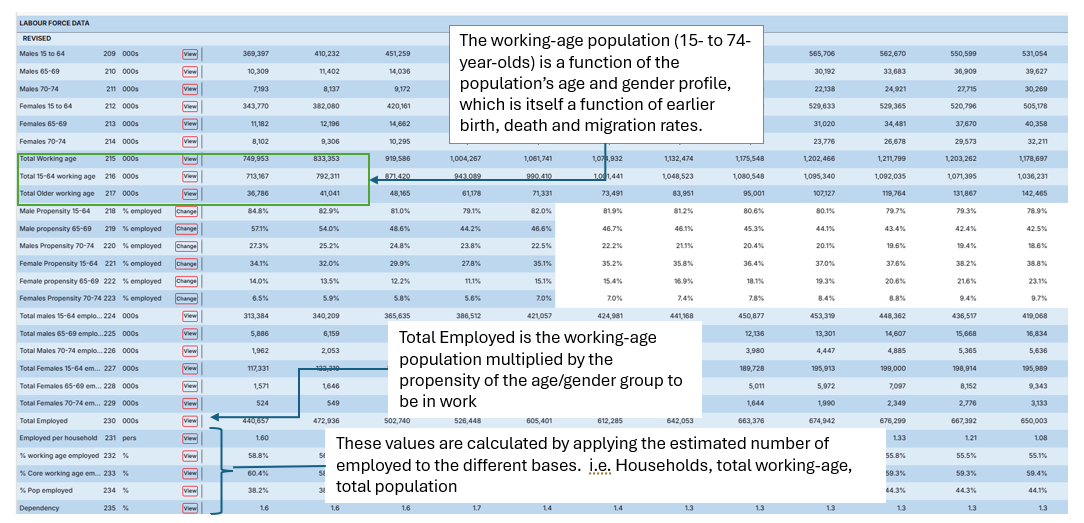
Underneath the interface is a statistical model of how a society develops: births, deaths and migration shape the population; education and the propensity to be employed shape the workforce; productivity and wage share shape incomes; and incomes shape household spending.

Actual data from 2005 to 2024/5 anchors every series, sourced from the United Nations, the World Bank and national statistical agencies. Projections to 2065 use proprietary algorithms refined over more than 25 years of modelling.

Because every series is linked, a change to one assumption ripples through all of them — which is exactly what makes the model worth interrogating rather than just reading.

The causal chain
Change one lever — everything downstream responds
Births · Deaths · Migration Population & age profile Education · Employment · Workforce Productivity · Wages · GDP Household incomes & spending
Why it is useful

No forecast is right. A range of them is a good deal more honest.

Our own forecasts are carefully prepared, but they are still one path through an uncertain future. The useful question is rarely what will happen — it is how much would it matter if we are wrong.

That is what this model is for. Take the variable you are least sure about, push it to the edge of plausible in both directions, and see how far the answer moves. Sometimes the economy barely notices. Sometimes a single percentage point on migration or participation rewrites the next forty years. Either way, you now know which assumptions your plan actually rests on.

Because the model solves the whole system at once, you never have to work out the second-order effects yourself. Fewer births today become fewer workers in twenty years, fewer households, a different age structure and a different consumer market — automatically, and consistently.

It is better to consider a range of possible outcomes, and their relative probability, than to bet everything on a single set of numbers. The case for scenarios
What you can ask it

Questions that used to need a research project.

Each of these is a couple of minutes’ work: pick the country, change the variable, run the scenario, read the difference table.

What happens to China’s urban labour force if the birth rate stays low?

And what does that do to its economy? Drop the birth rate, run the scenario, and read the answer straight off the Labour Force and GDP tables.

What if Vietnam’s participation rate falls from today’s highs?

Male participation currently runs at 89%. Very few countries hold that. Ease it back and see what it costs in workers and in output.

What if female participation in the labour force increased in India?

Currently only 35% are employed, but with universal education that should increase. What would the effect of that be on the economy?

How sensitive is Britain’s workforce to constrained immigration?

Migration feeds births, working-age numbers and household formation. Constrain it and every one of those adjusts together.

What does a whole region look like if you add it up?

Select all of Western Europe and the model aggregates it into one set of tables — population, workforce, income and spending combined.

How it works

Five steps, start to finish.

Nothing to install and nothing to set up — the whole workflow fits on one screen. The online manual explains every button and field with screenshots.

01

Choose a country

Or several — the model aggregates them into one set of tables.

02

Choose your view

Which topics, which tables and which years appear on screen.

03

Change a variable

One at a time or several together, for any future year.

04

Run the scenario

Every dependent variable re-solves, usually in a moment.

05

Read it or take it

On screen as tables and charts, or downloaded as an Excel file.

Open the full manual

The controls

Fourteen levers — and why only fourteen.

The model holds 82 variables, but you can change only 14 of them. That is deliberate. You cannot simply decide how many twenty-year-olds a country has next year: that number is a function of the births of twenty years ago, adjusted for migration and mortality. The model does that arithmetic. What is left for you are the things a government, an economy or a society could genuinely influence.

Population

  1. Birth rate, per thousand women aged 15–49
  2. Net migration, as a % of total population

Labour force

  1. Male propensity to be employed, 15–64
  2. Male propensity to be employed, 65–69
  3. Male propensity to be employed, 70–74
  4. Female propensity to be employed, 15–64
  5. Female propensity to be employed, 65–69
  6. Female propensity to be employed, 70–74

Productivity and output

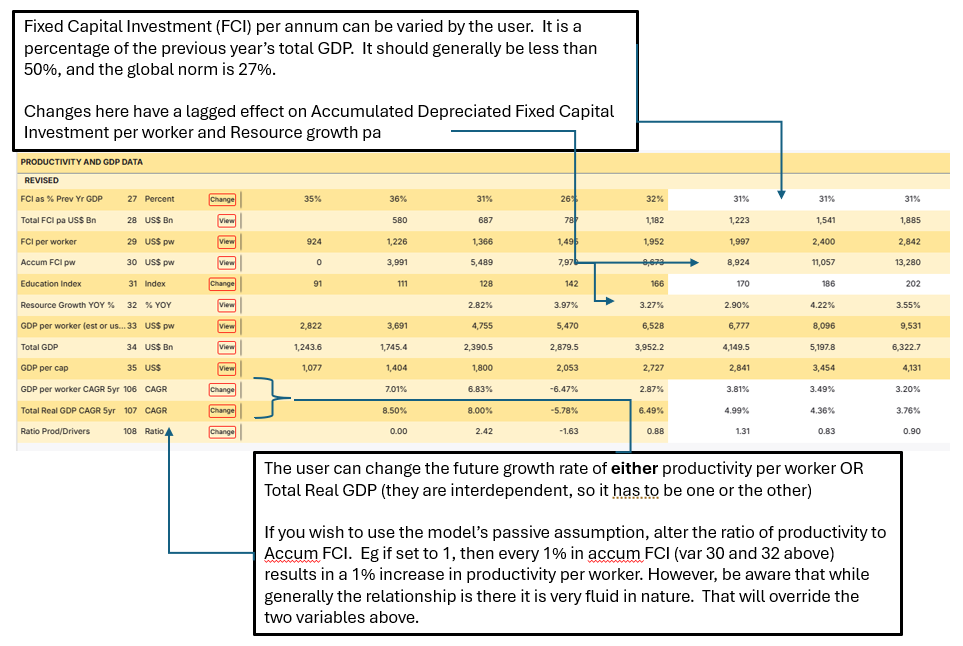
  1. Percent of previous year’s GDP invested in fixed capital
  2. Growth rate of GDP per worker — productivity
  3. Growth rate of total GDP

Incomes and spending

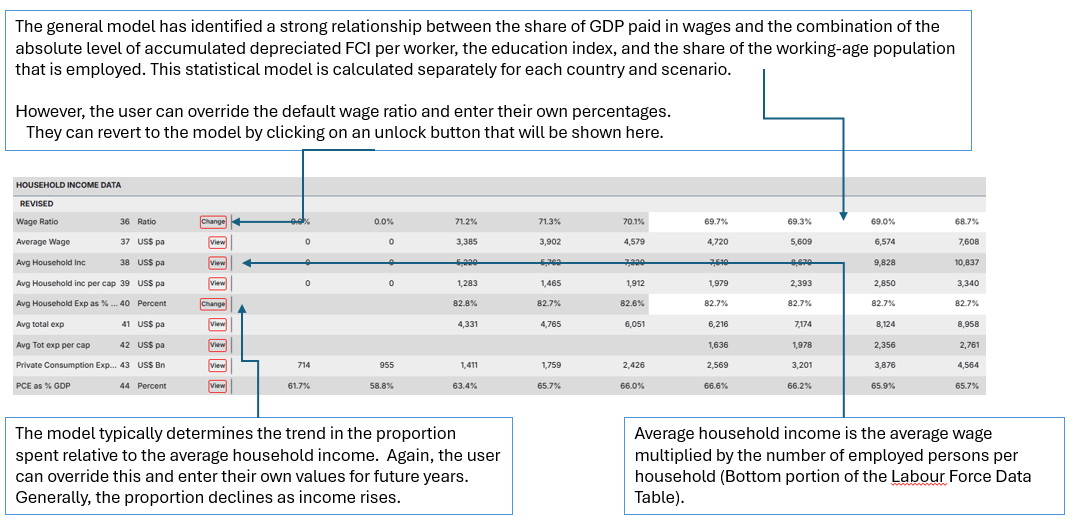
  1. Wage ratio — the share of productivity reaching the worker
  2. Propensity of households to spend
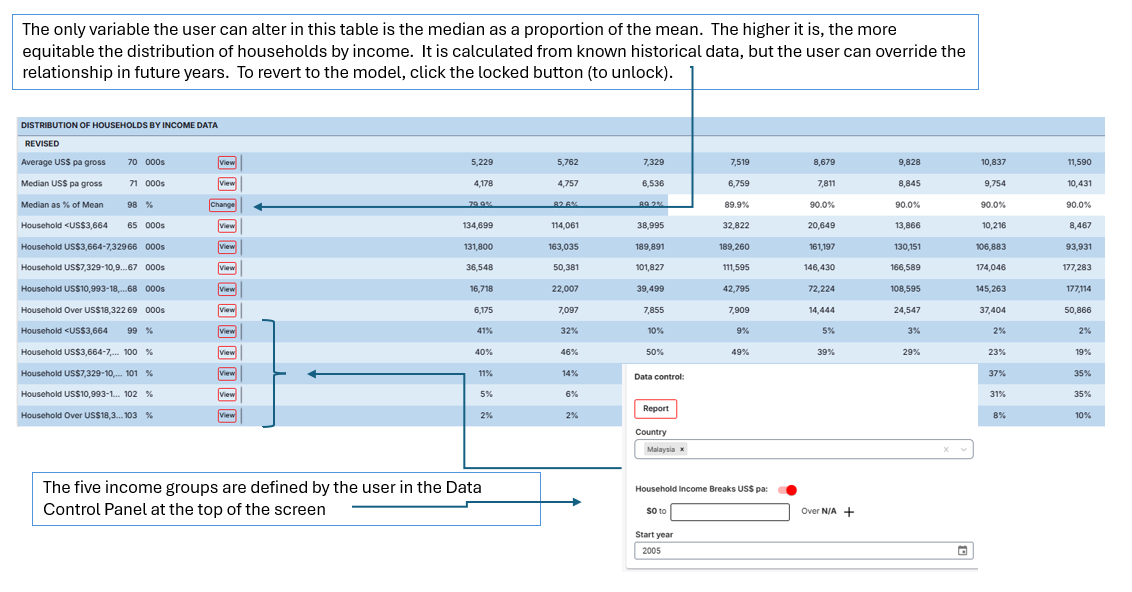
  3. Median income as a % of average income — income disparity
Worth knowing

You can only change values for future years — history stays history. And changes accumulate: alter migration, look at the result, then alter participation on top of it, and the second scenario builds on the first rather than replacing it.

Reading the output

Every topic comes as three tables.

This is the one idea worth understanding before you start. Whatever topic you open, the same three views are available — and they answer three different questions.

Base

Our forecast, untouched. It is what loads when you open a dataset and it stays put no matter what you do, so you always have a fixed point to measure against.

Revised

Your scenario. It starts identical to Base and becomes yours the moment you change a variable and then run the model. This is the table you work in — and the one that must be on screen if you want to see your changes.

Difference

Revised minus Base: the size and direction of what you have just done, without any mental arithmetic. For most questions, this is the table that contains the answer.

The topic tables

Six topics, and what each one is for.

Show one, show all of them, or switch between them without re-running anything.

The starting point, and the only topic where you change just two things: the birth rate per thousand women aged 15–49, and net migration as a percentage of total population, positive or negative. Everything else here — women of childbearing age, total births, deaths, population, household size and total households — is calculated from those. The absolute number of migrants appears near the foot of the table, so you can see what a percentage actually means in people.
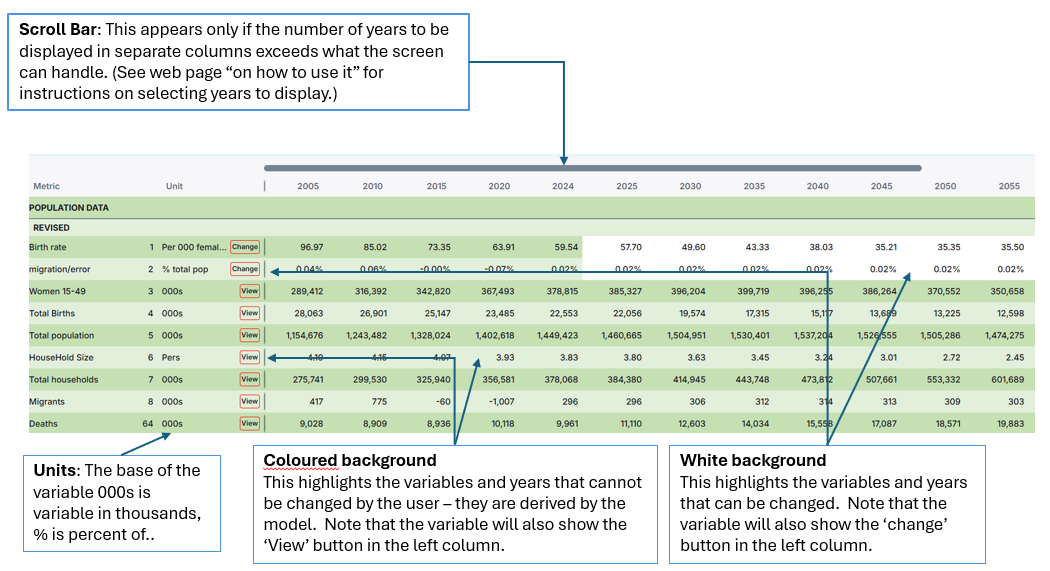
The Population topic table
Coverage

What you get access to.

Two packages, available separately or together at a combined discount.

Country package

  • 109 countries, individually or in any combination
  • Includes Mainland China as a single total
  • Select a whole region and the model aggregates it
  • The full 82-variable model for every country
See the country list

China package

  • China national, and China national urban

Available soon:

  • All 31 provinces
  • The 100 largest prefectures by urban population
  • Including every provincial capital prefecture
See the China list
About the data

History typically runs from 2005 to 2023 and is actual data from the United Nations and the World Bank. Forecasts run from there to 2065. All financial variables are expressed in real 2023 US dollars at 2023 exchange rates, so figures are comparable across countries and across time without any adjustment on your part.

Pricing

All 109 countries in every plan. Pay only for the time you need.

Need an answer for one meeting? A day pass covers it. Living in the model? Subscribe by the month or put the whole office on it for a year. A free trial is available before you commit anything.

Day pass

US$5
per day · 1 user

Full access to every country and every variable for 24 hours. Perfect for a specific question or a deadline.

Get a day pass
Most popular

Monthly

US$100
per month · 1 user

Unlimited scenarios across all 109 countries, with Excel downloads. Cancel any time.

Subscribe monthly

Annual — office

US$1,000
per year · per office

A full year of access for your whole office. The working tool for teams that plan on demographic timescales.

Subscribe annually

All prices in US dollars. Subscriptions and the free trial are managed at interdem.globaldemographics.com.

Reference

Every variable in the model.

All 82, grouped as they appear on screen. The last two groups are available for a single country at a time.

Population9 variables
  • Birth rate (per 000)
  • Migration rate (% total population)
  • Women aged 15–49 years (000s)
  • Total births (000s)
  • Total population (000s)
  • Household size (persons)
  • Total households (000s)
  • Migrants (000s)
  • Deaths per annum (000s)
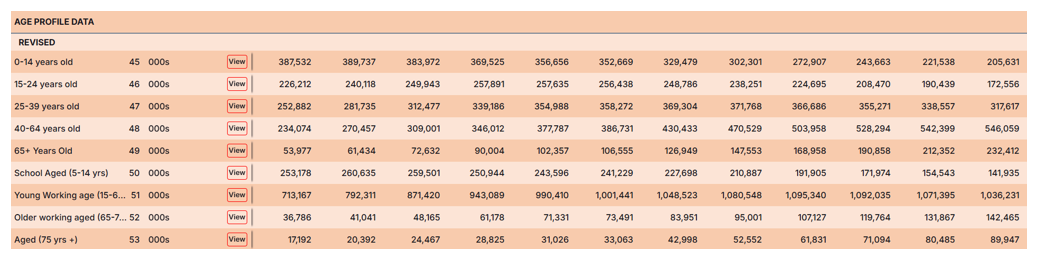
Labour Force18 variables
  • Males 15–64
  • Males 65–74
  • Females 15–64
  • Females 65–74
  • Total working age
  • Male propensity 15–64
  • Male propensity 65–74
  • Female propensity 15–64
  • Female propensity 65–74
  • Total males 15–64 employed
  • Total males 65–74 employed
  • Total females 15–64 employed
  • Total females 65–74 employed
  • Total employed
  • Employed per household
  • % working age employed
  • % population employed
  • Dependency
Productivity & GDP8 variables
  • FCI as % previous year GDP
  • Total FCI p.a. US$ bn
  • FCI per worker
  • Accumulated FCI per worker
  • Education index
  • GDP per worker
  • Total GDP
  • GDP per capita
Household Income9 variables
  • Wage ratio
  • Average wage
  • Average household income
  • Average household income per capita
  • Average household expenditure as % income
  • Average total expenditure
  • Average total expenditure per capita
  • PCE
  • PCE as % GDP
Age Profile9 variables
  • 0–14 yrs
  • 15–24 yrs
  • 25–39 yrs
  • 40–64 yrs
  • 65+ yrs
  • School aged (6–15)
  • Young working aged (15–64)
  • Older working aged (65–74)
  • Aged (75 yrs +)
Distribution of Households by Incomesingle country
  • Average US$ p.a. gross
  • Median US$ p.a. gross
  • Median as % of mean
  • Households (000s) in each of five segments
  • Households % in each of five segments
Household Expenditure by Income Groupper segment
  • Households 000s
  • Percent of all households
  • Gross income US$ p.a.
  • Percent spent
  • Total spent
  • Food and non-alcoholic beverages
  • Alcohol and tobacco
  • Clothing and footwear
  • Housing
  • Utilities
  • Durables and daily-use items
  • Health
  • Transport
  • Communications
  • Recreation and culture
  • Education
  • Other

Household expenditure is repeated for each of the five income segments you define. Full definitions of every variable are on the data and methodology page.

See for yourself

The best way to understand the model is to change its mind.

Open the free trial, pick a country you know well, and test your own view of its future against the arithmetic.