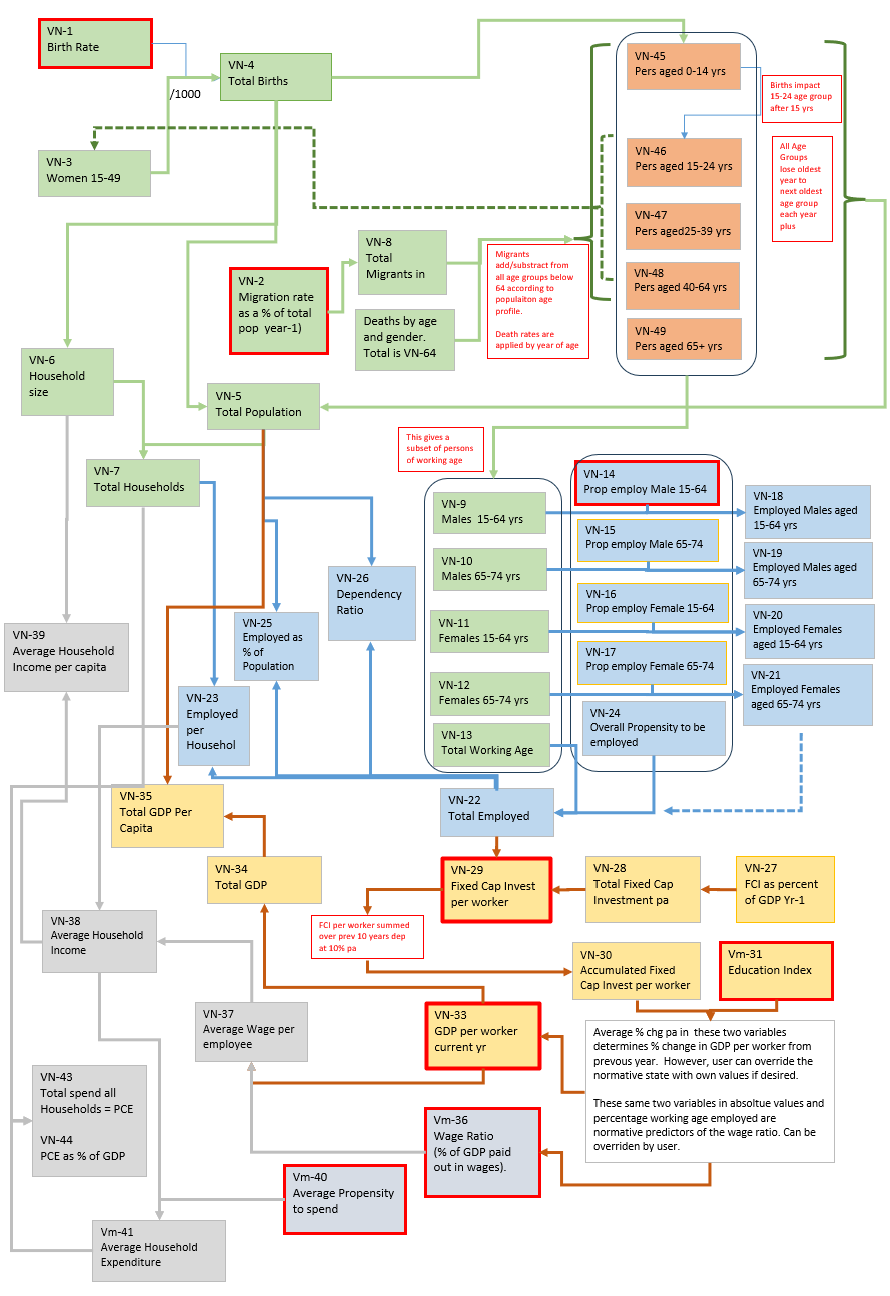
Schematic of the Statistical Model
This schematic of the model provides the user with a clear description of how the model works.
Items with a red border are the ones that the user can alter; the others are all recalculated as a result of those changes. The forecasts are based on the default values in the ‘changeable’ variables and change if the ‘changeable’ variables are modified. The solution process follows the order of variables as numbered.
See below for more information on this diagram.

The variables are colour-coded as follows
- Red Border – can be altered by the user.
- Green – demographic variables (Births, immigration, deaths, age profile, households).
- Blue – labour force-related variables.
- Yellow – Productivity and GDP.
- Grey – wages, household income and total expenditure.
Note that there are additional sections showing the distribution of households by gross income per annum and per household expenditure pattern by income segments. These are a function of the results of the model described above, with the exception being that the user can vary the median as a percentage of the mean gross household income to reflect expected changes in income distribution in society.


