Interactive Demographics
Create your own Future Demographic Scenarios for any country in seconds.
Demographics have a profound impact on a country’s future. But what will that future look like? Only a handful of factors shape future demographic profiles, yet changes in these can have a profound effect on the population, households, workforce, and economy. The Interactive Demographic Model allows you to view a range of outcomes instantly.
It is a valuable strategic and investment planning tool that is instantly available online.
Why is it useful?
Very few forecasts are entirely accurate. It’s more helpful to consider different scenarios for the relevant variables and evaluate the risks associated with various outcomes. What’s the magnitude of the change? Which variables have the most significant impact?
Interactive Demographics enables you to visualise the sensitivity of a country’s future demographic and socio-economic profile (to 2065) to variations in key variables. You simply …..
- for any one, or combination of, the 114 countries, 31 Provinces, and 20 key Prefectures of China included in the database
- vary one or more key variables which impact the future demographic and socioeconomic profile
- and see the impact of that change on each of 82 demographic and socio-economic variables profiling the country
- from 2025 to 2065
- in seconds
You can observe the actual trend of a variable from 2005 to 2024 (source: World Bank and UN) and the potential impact of changes to those variables if you make specific assumptions about the future.
For Example:
- What happens to China’s urban labour force if the birth rate stays low
- What about its economy
- What happens to Vietnam’s economy if the labour force participation rate falls from its high levels today (89% for males)
- If India slows its Fixed Capital Investment, what are the implications for labour force productivity?
- How sensitive is Britain’s workforce and economy if immigration is constrained?
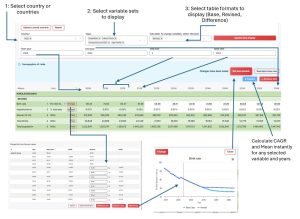
It is easy to use - Five easy steps
- Choose a country (or group of countries)
- Select the data sets and years you want on your screen
- Select the variables you want to change and change them (either one at a time or collectively)
- See the impact of those changes on other dependent variables (either individually or in Excel-type tables)
- Download the results in Excel format
Countries/Regions included
- Country Package:
- A total of 112 countries are included in the Country Package
- Click here for a listing of the countries by region
- Note- this package contains Mainland China Total
- China Package: In the China Package, the following is available
- China National
- China National – Urban
- 31 Provinces
- 100 Prefectures (largest by urban population), including all provincial capital Prefectures.
- You may also purchase both packages together, providing a combined discount.
The variables included in the total model
A diagram of how the model solves is available here
In total, there are 82 variables included in the model and its output tables
A listing of these variables is given below
For all variables, the data runs typically from 2005 to 2023 actual (as published by the UN and the World Bank)
All Financial variables (e.g. Gross National Product, Household Income, etc) are expressed in US$ real 2023 values. Using the 2023 exchange rate for local currency to US$
Of the 82 variables, only 13 are directly changeable by the user, reflecting the real world.
For example, you cannot arbitrarily change the number of 14-year-olds—that is a function of the number of births 14 years ago, plus migrants (inward or outward) of that age group and deaths of that age cohort over the last 14 years. The model performs these calculations to determine the number of 14-year-olds in year ‘X accurately’.
The variables you can change are:
- Birth Rate (per 000)
- Migration rate (% total population)
- Male Propensity 15-64
- Male propensity 65-74 default 0
- Female Propensity 15-64
- Female propensity 65-74 default 0
- FCI per worker
- Education Index
- Wage Ratio
- Average Household Expenditure as a percent of total income
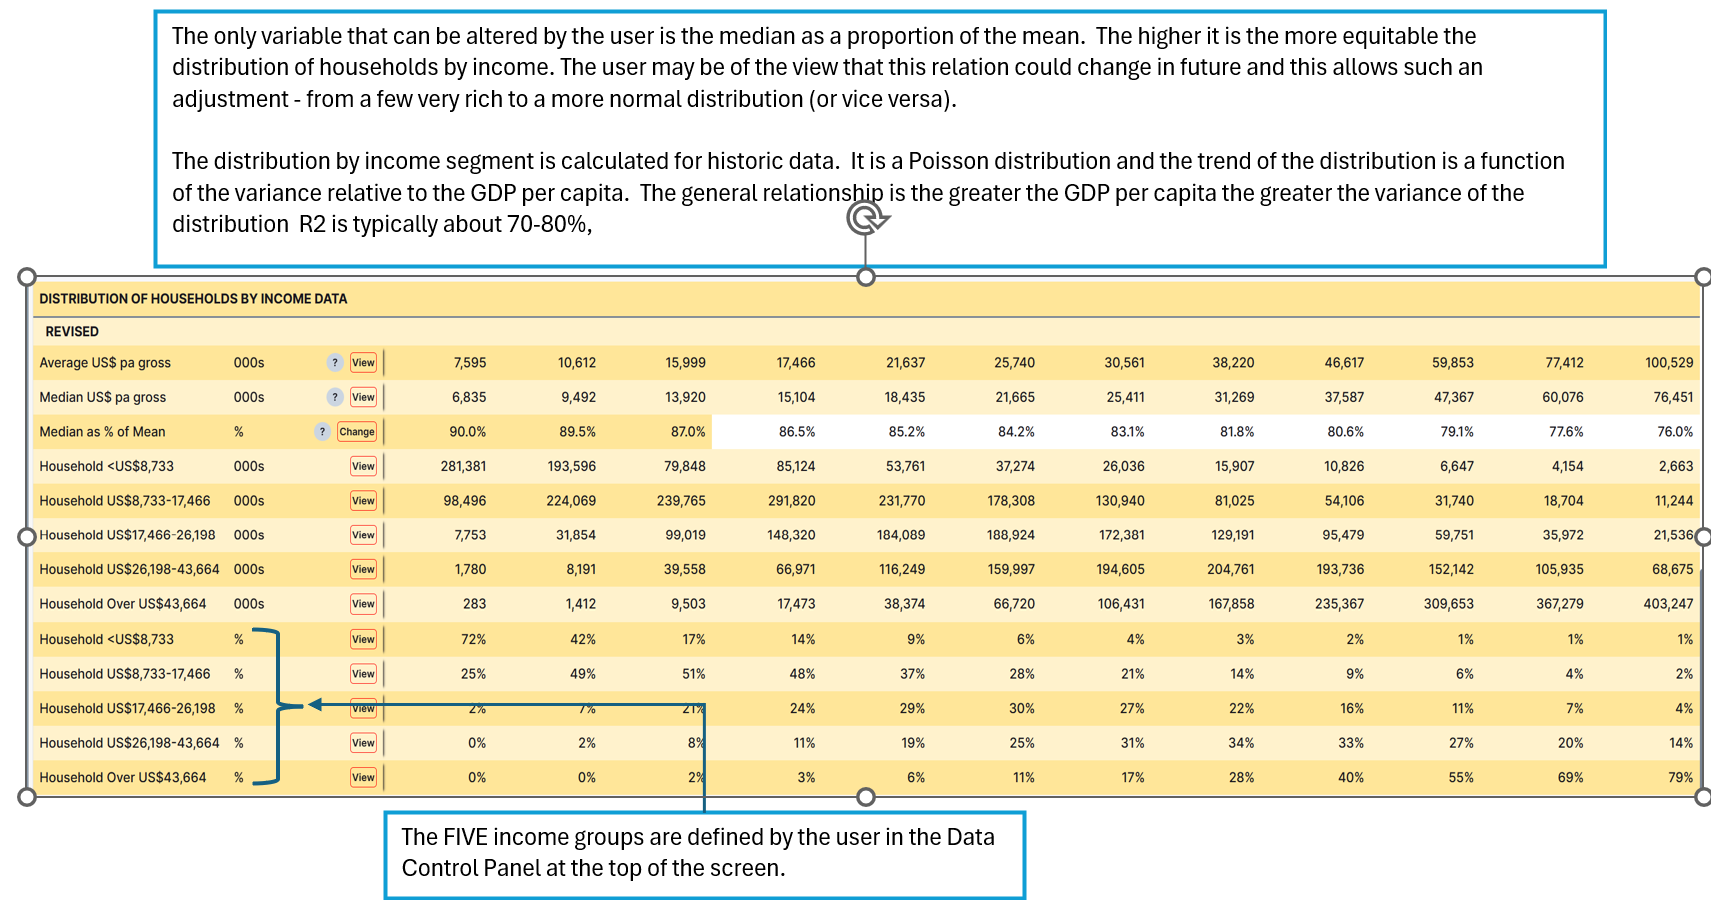
- Median Household income as a percent of Average household income
- Breakpoints for defining five income segments
The total variable set that can be displayed is:
- Birth Rate (per 000)
- Migration rate (% total population)
- Women aged 15-49 years (000s)
- Total Births (000s)
- Total Population (000s)
- Household size (persons)
- Total Households (000s)
- Migrants (000s)
- Deaths per annum (000s)
- Males 15 to 64
- Males 65-74
- Females 15 to 64
- Females 65-74
- Total Working Age
- Male Propensity 15-64
- Male propensity 65-74 default 0
- Female Propensity 15-64
- Female propensity 65-74 default 0
- Total males 15-64 employed
- Total males 65-74 employed
- Total Females 15-64 employed
- Total Females 65-74 employed
- Total Employed
- Employed per household
- % Working Age employed
- % Pop employed
- Dependency
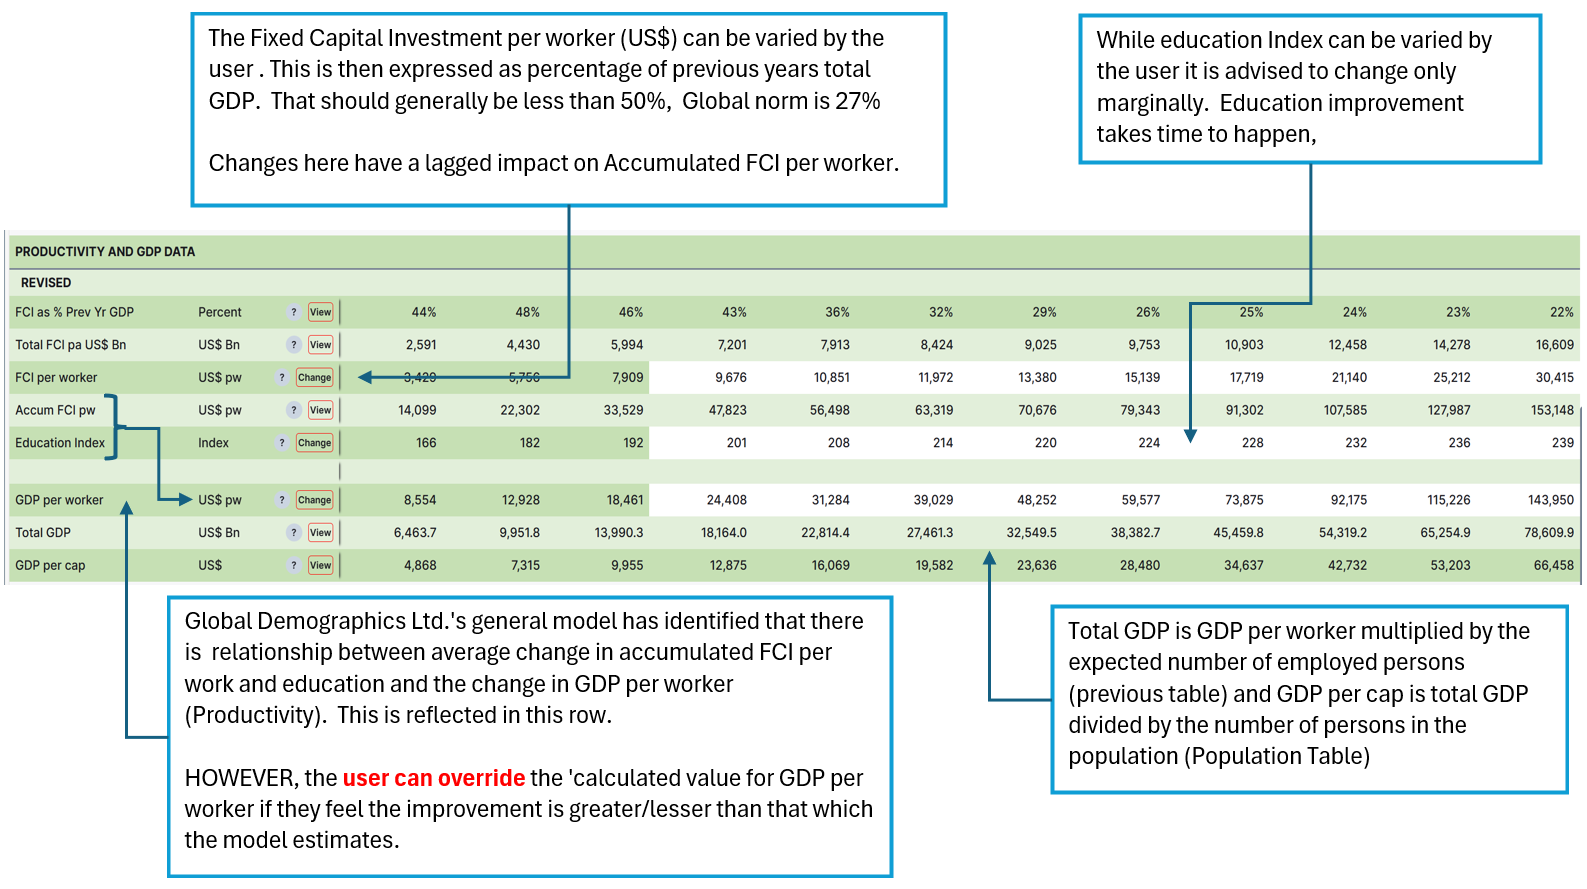
- FCI as % Prev Yr. GDP
- Total FCI pa US$ Bn
- FCI per worker
- Accum FCI pw
- Education Index
- GDP per worker
- Total GDP
- GDP per cap
- Wage Ratio
- Average Wage
- Avg HH Inc
- Avg HH inc per cap
- Avg HH Exp as % Inc
- Avg total exp
- Avg Tot exp per cap
- Pce
- PCE as % GDP
- 0-14 yrs.
- 15-24 yrs.
- 25-39 yrs.
- 40-64 yrs.
- 65+ yrs.
- School aged (6 to 15)
- Young working aged (15-64)
- Older Working Aged (65-74)
- Aged (75 yrs. +)
- Note: Not available when more than one country selected
- Average US$ pa gross
- Median US$ pa gross
- Median as % of Mean
- Households )000s in each of 5 user defined income segments
- Households % in each of 5 user defined income segments
- Note: Not available when more than one country selected
- Households 000s
- Percent of all Households
- Gross Income US$ pa
- Percent spent
- Total spent
- Food and Non-alcoholic Bev.
- Alcohol and Tobacco
- Clothing and Footwear
- Housing
- Utilities
- Durables and Daily Use items
- Health
- Transport
- Communications
- Recreation and Culture
- Education
- Other
The Topic Tables (and sub tables)
TOPIC TABLES
The model is obviously ‘data-rich’, so to make it more manageable, the overall data set is divided into 5 ‘Topics’ – with separate tables displayed for each.
The Topic Tables are:
-
- Population
- Labour Force
- Productivity and GDP
- Household Income
- Age Profile
- Distribution of Households by Income
- Household Expenditure Patterns by Income Segment
The user can select which ones are displayed on their screen at any time—just one, all, or any permutation of them. The selection can be varied at any time without rerunning the scenario.
SUB TABLES
The Subtables are variations of the same TOPIC table (only the ‘Revised’ Tables are displayed below).
There are three sub-tables
- Base Table—this is the data provided initially when the dataset is opened. The forecast years contain Global Demographics Ltd’s forecasts and are intended as a starting point. The user can overwrite the base data at any time with the results of a scenario they have run, which is the content of the base table. Essentially, this is the ‘reference point’ against which to compare other changes.
- The ‘Revised‘ Table initially displays the default values (as described in the base table above). It then changes to the values resulting from running a scenario.
NOTE: The ‘Revised’ table is the one that enables users to make changes to variables and run scenarios. It is the one that is used most.
3. The ‘Impact‘ Table shows the difference between the Basic and Revised tables so the user can easily see the size and direction of change resulting from the different scenarios.
The nature of each of the Topic Tables is shown below. In each case the ‘revised’ version is shown.
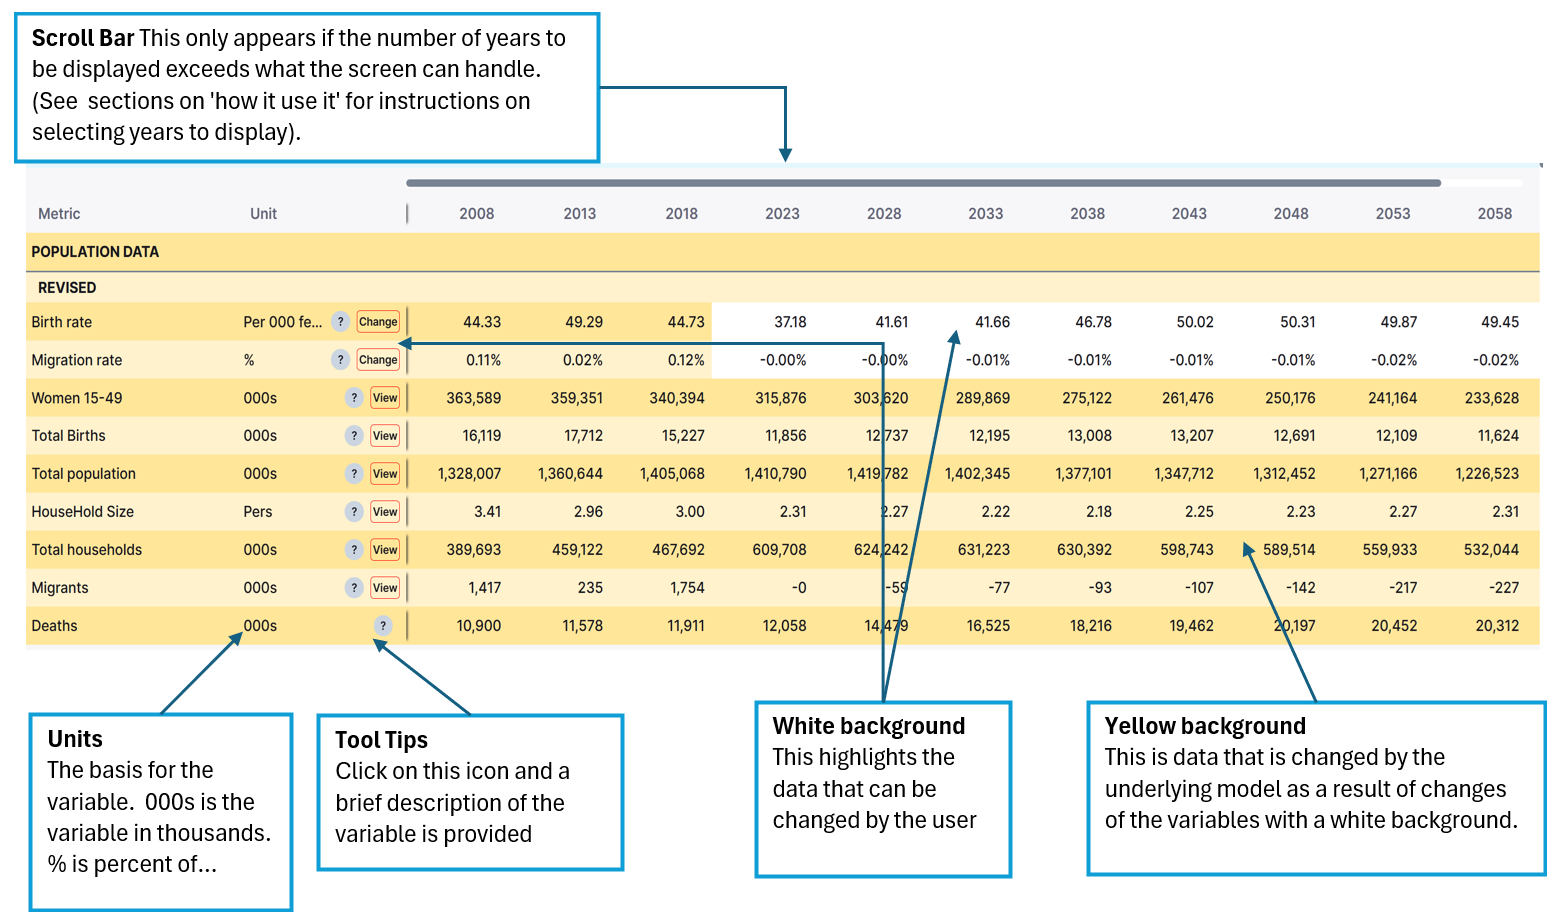
NOTE
Only two variables can be changed in this Topic Table: birth rate (per thousand females aged 15 to 49) and immigration (expressed as a percentage, positive or negative as appropriate, of the total population). (The absolute number of migrants is given in this table’s second-to-last row.)
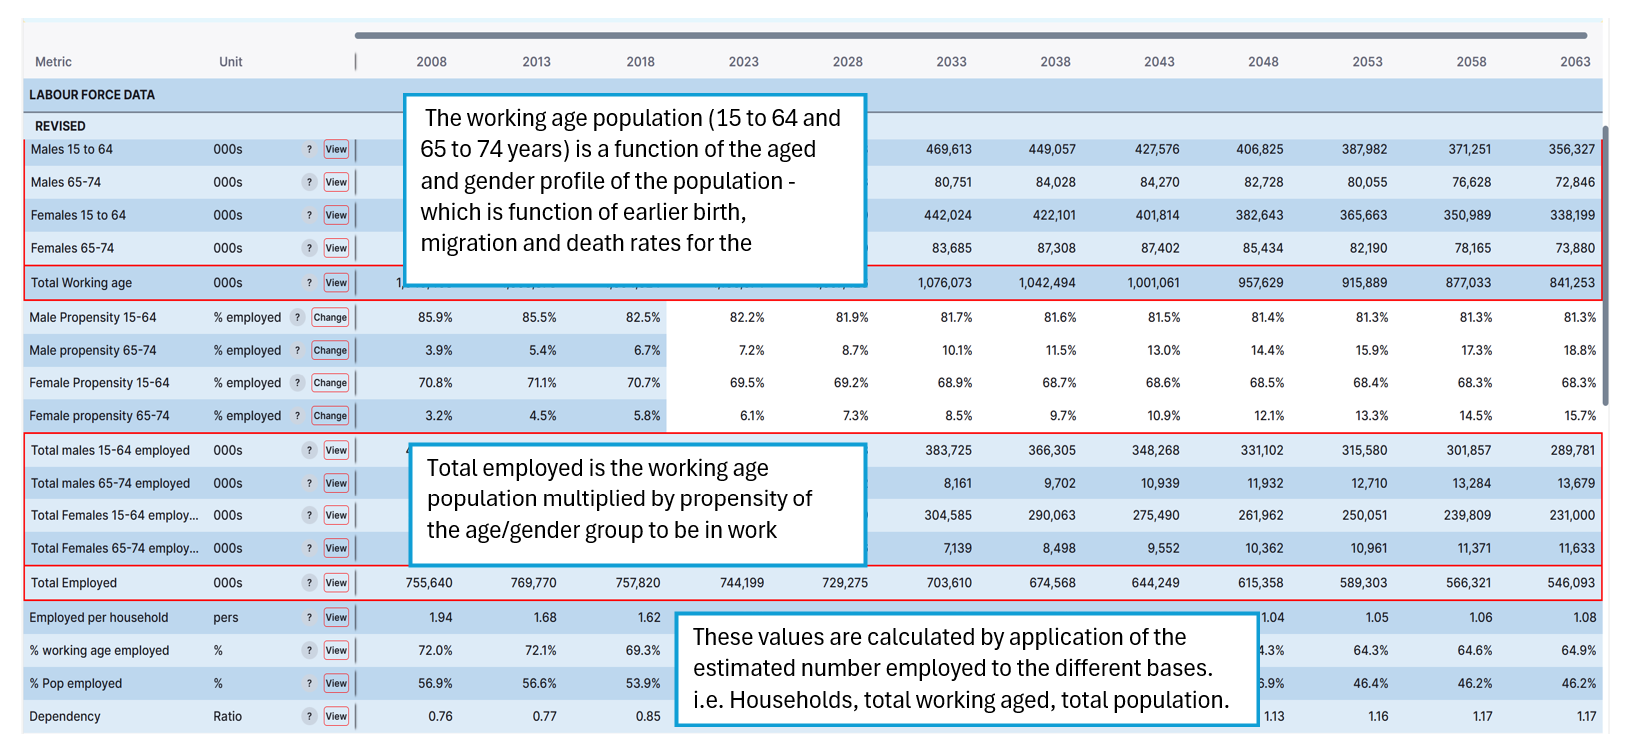
Labour Force Data
The propensity to be employed by each age group are the only variables that can be changed here. This can range from 0% (possible for the older age group) to 100% (unlikely – typically 70% to 90%)
Productivity and GDP Data
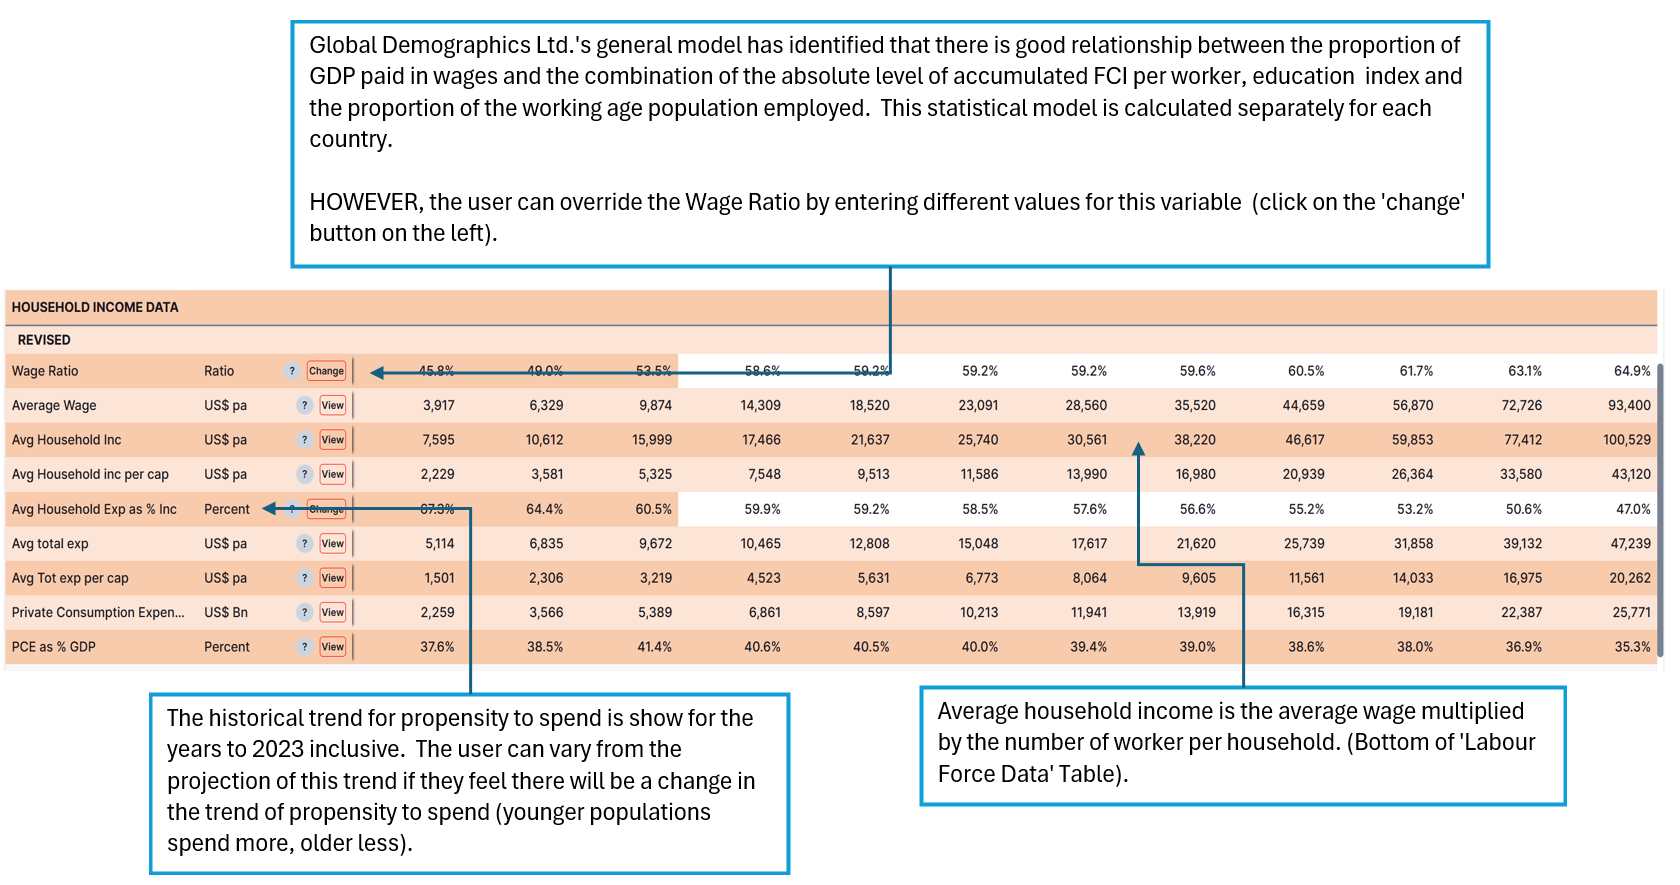
Household Income Data
Overall household incomes are a function of the proportion of GDP per worker paid out in wages (Wage ratio) and the number of workers in the household as calculated at the bottom of the Labour Force Data Table.
Age Profile Data
This table summarises key age segments and groups.
There is no user interaction in this table.
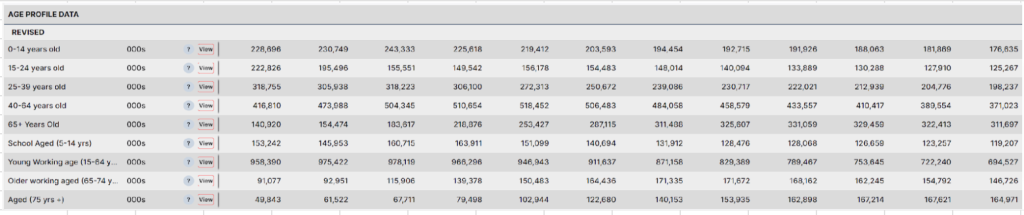
All values in this table are calculated taking into account births in the year, migration age profile and death rate by gender/age
All calculation is done by single age years, then summed by age group.
Distribution of Households by Income.