Interactive Demographics Manual
- How to Subscribe/login
- Interactive Demographics
- Schematic of the Statistical Model
- How to use it
- 1. CHOOSE A COUNTRY OR COUNTRIES
- 2. SELECTING TOPICS AND SUB TABLES TO BE DISPLAYED
- 3. YEARS TO DISPLAY
- 4. APPLYING CHANGES BUTTON
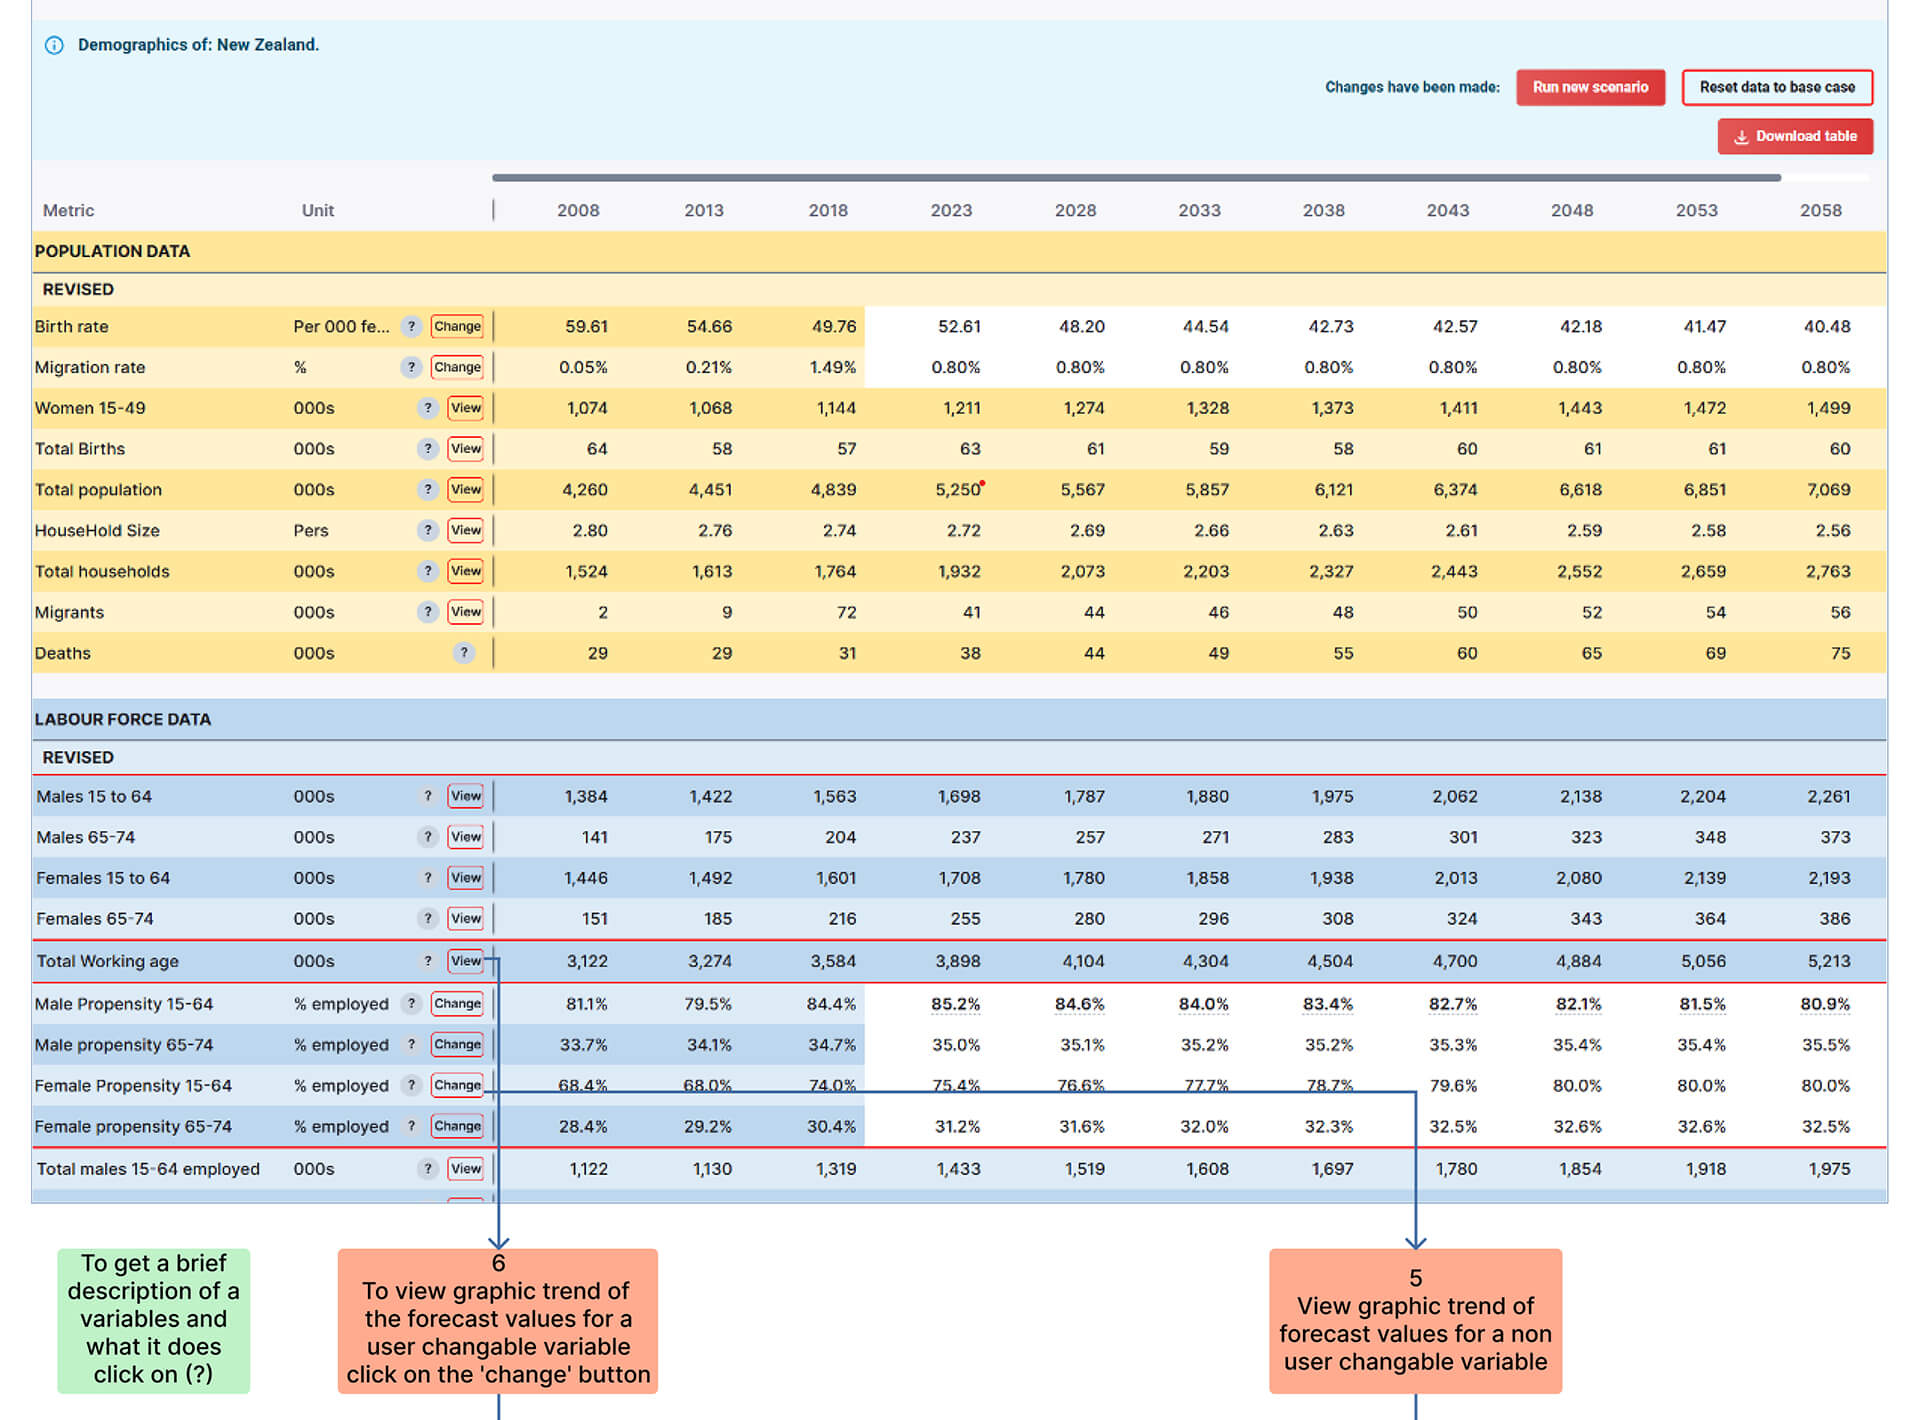
- 5. TO VIEW A GRAPHIC OF THE FORECAST VALUES FOR A VARIABLE THAT CANNOT BE CHANGED DIRECTLY BY THE USER
- 6. TO SEE AND/OR CHANGE THE VALUES IN A USER CHANGEABLE VARIABLE
- 7. TO CHANGE THE STATE OF A CHANGEABLE VARIABLE
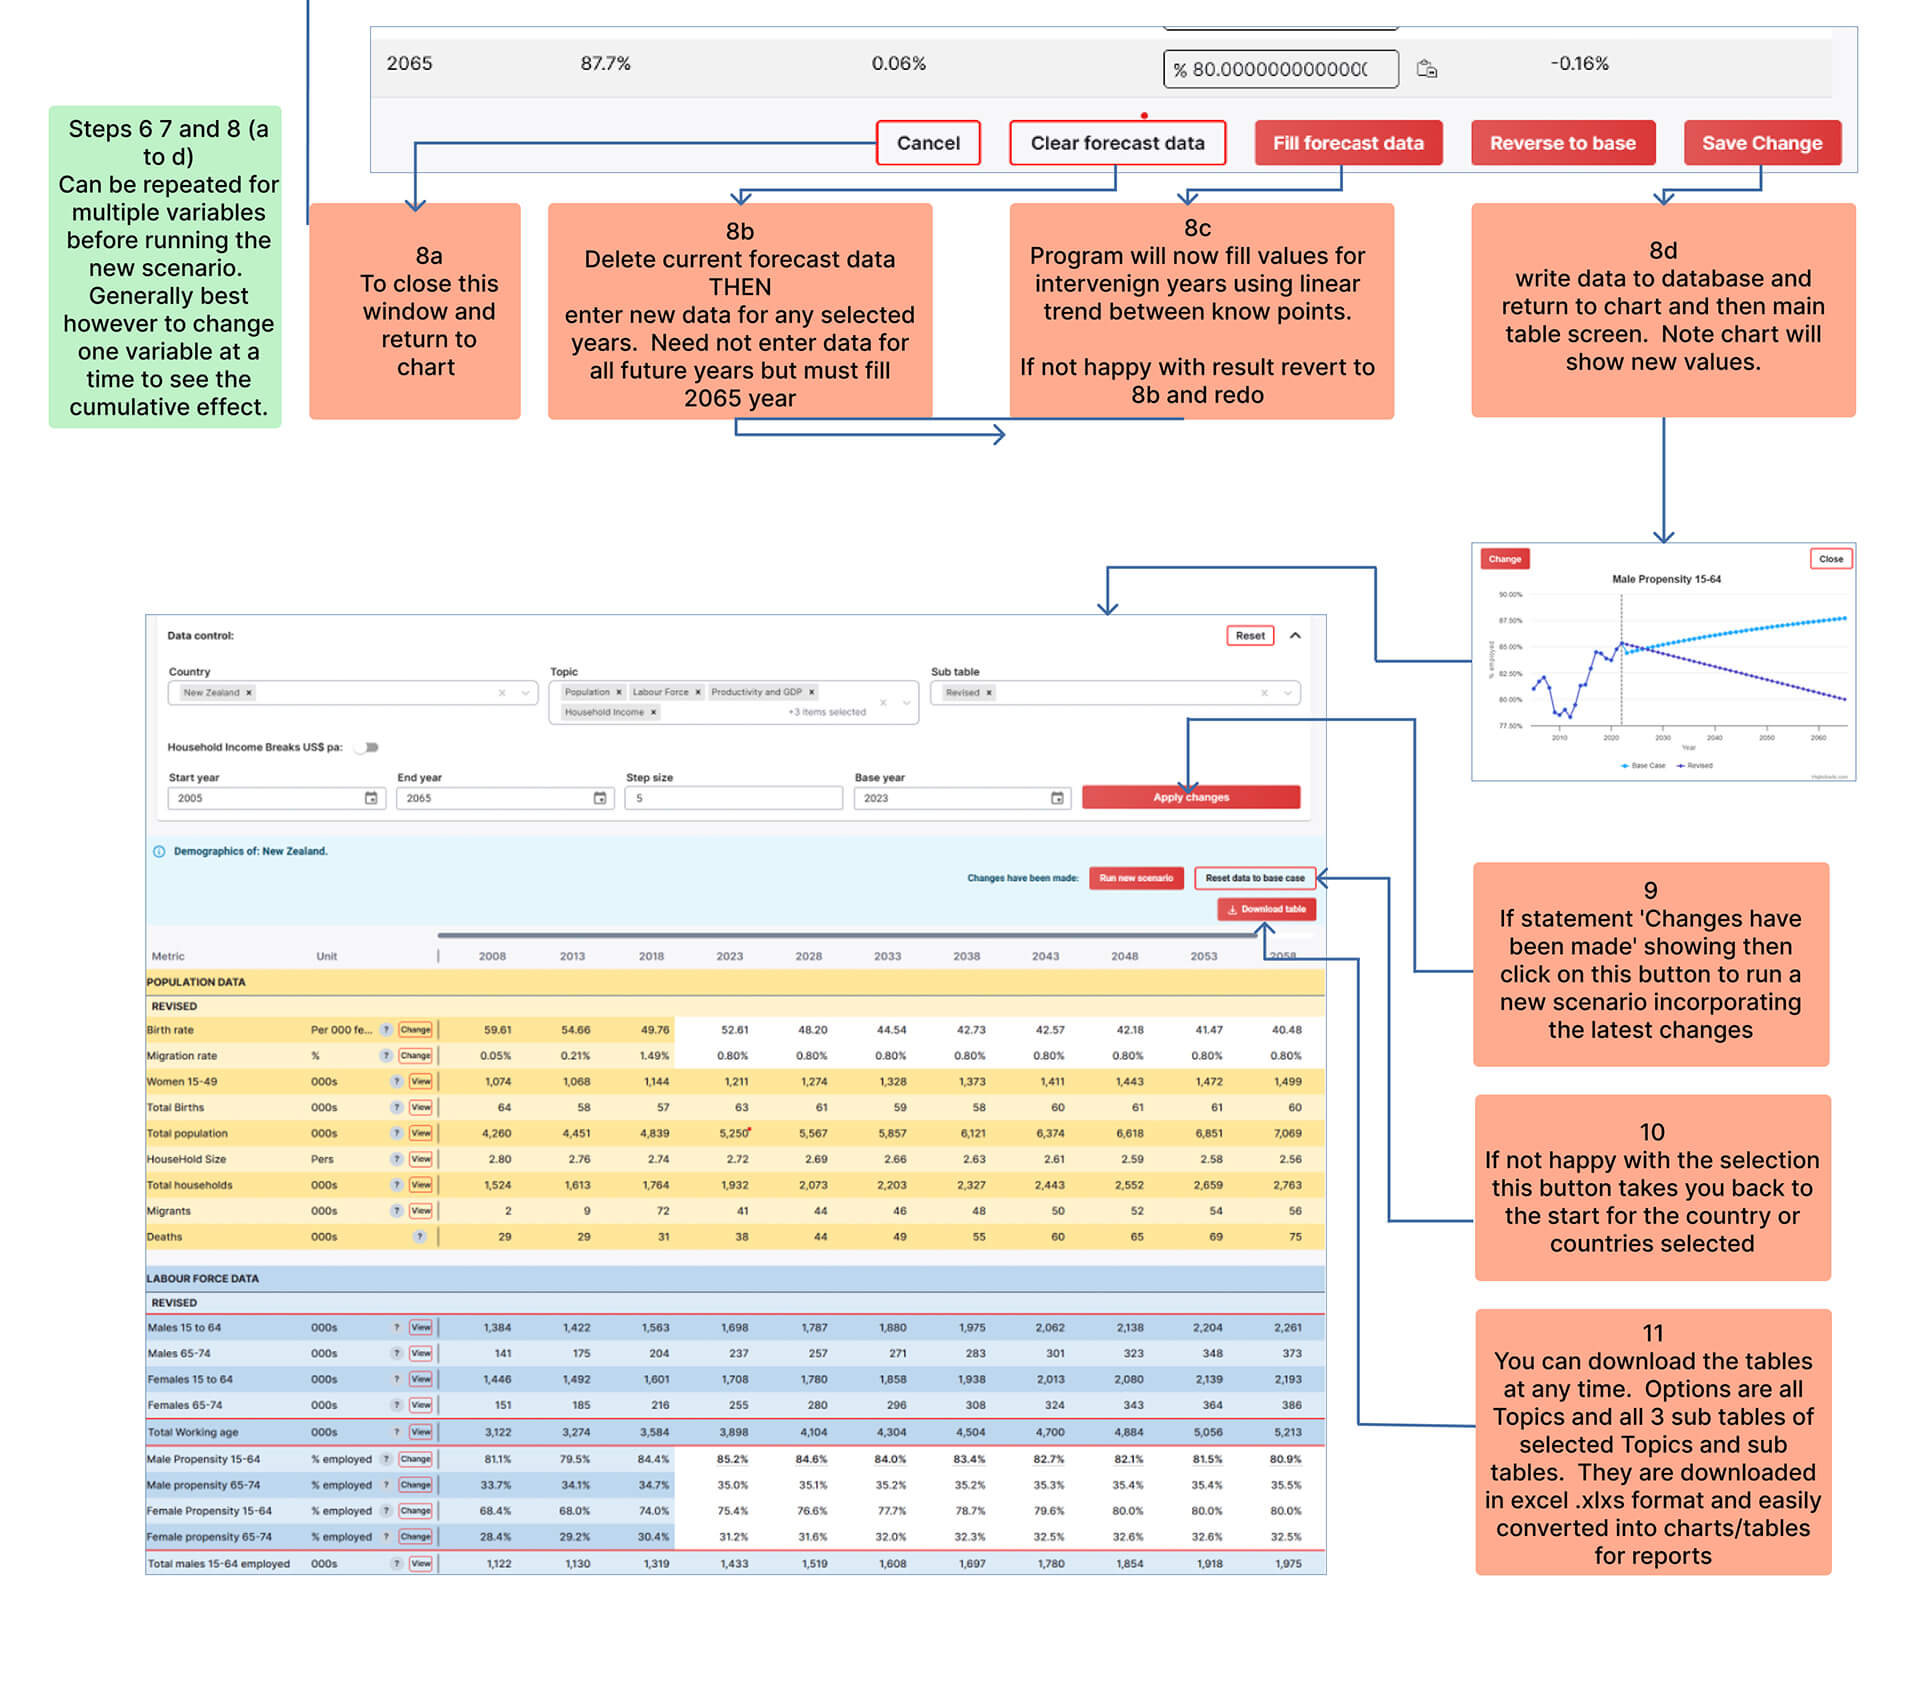
- 8. SETTING NEW VALUES FOR THE SELECTED VARIABLE
- 9. RUN SCENARIO
- 10. TO RETURN TO THE ORIGINLAL CASE SIMPLY CLICK ON THE 'RESET DATA TO BASE CASE' BUTTON AT THE TOP OF THE TABLES
- 11. DOWNLOAD
- 12. SET INCOME SEGMENT BREAKS
- Variable definitions
INTERACTIVE DEMOGRAPHIC MODEL
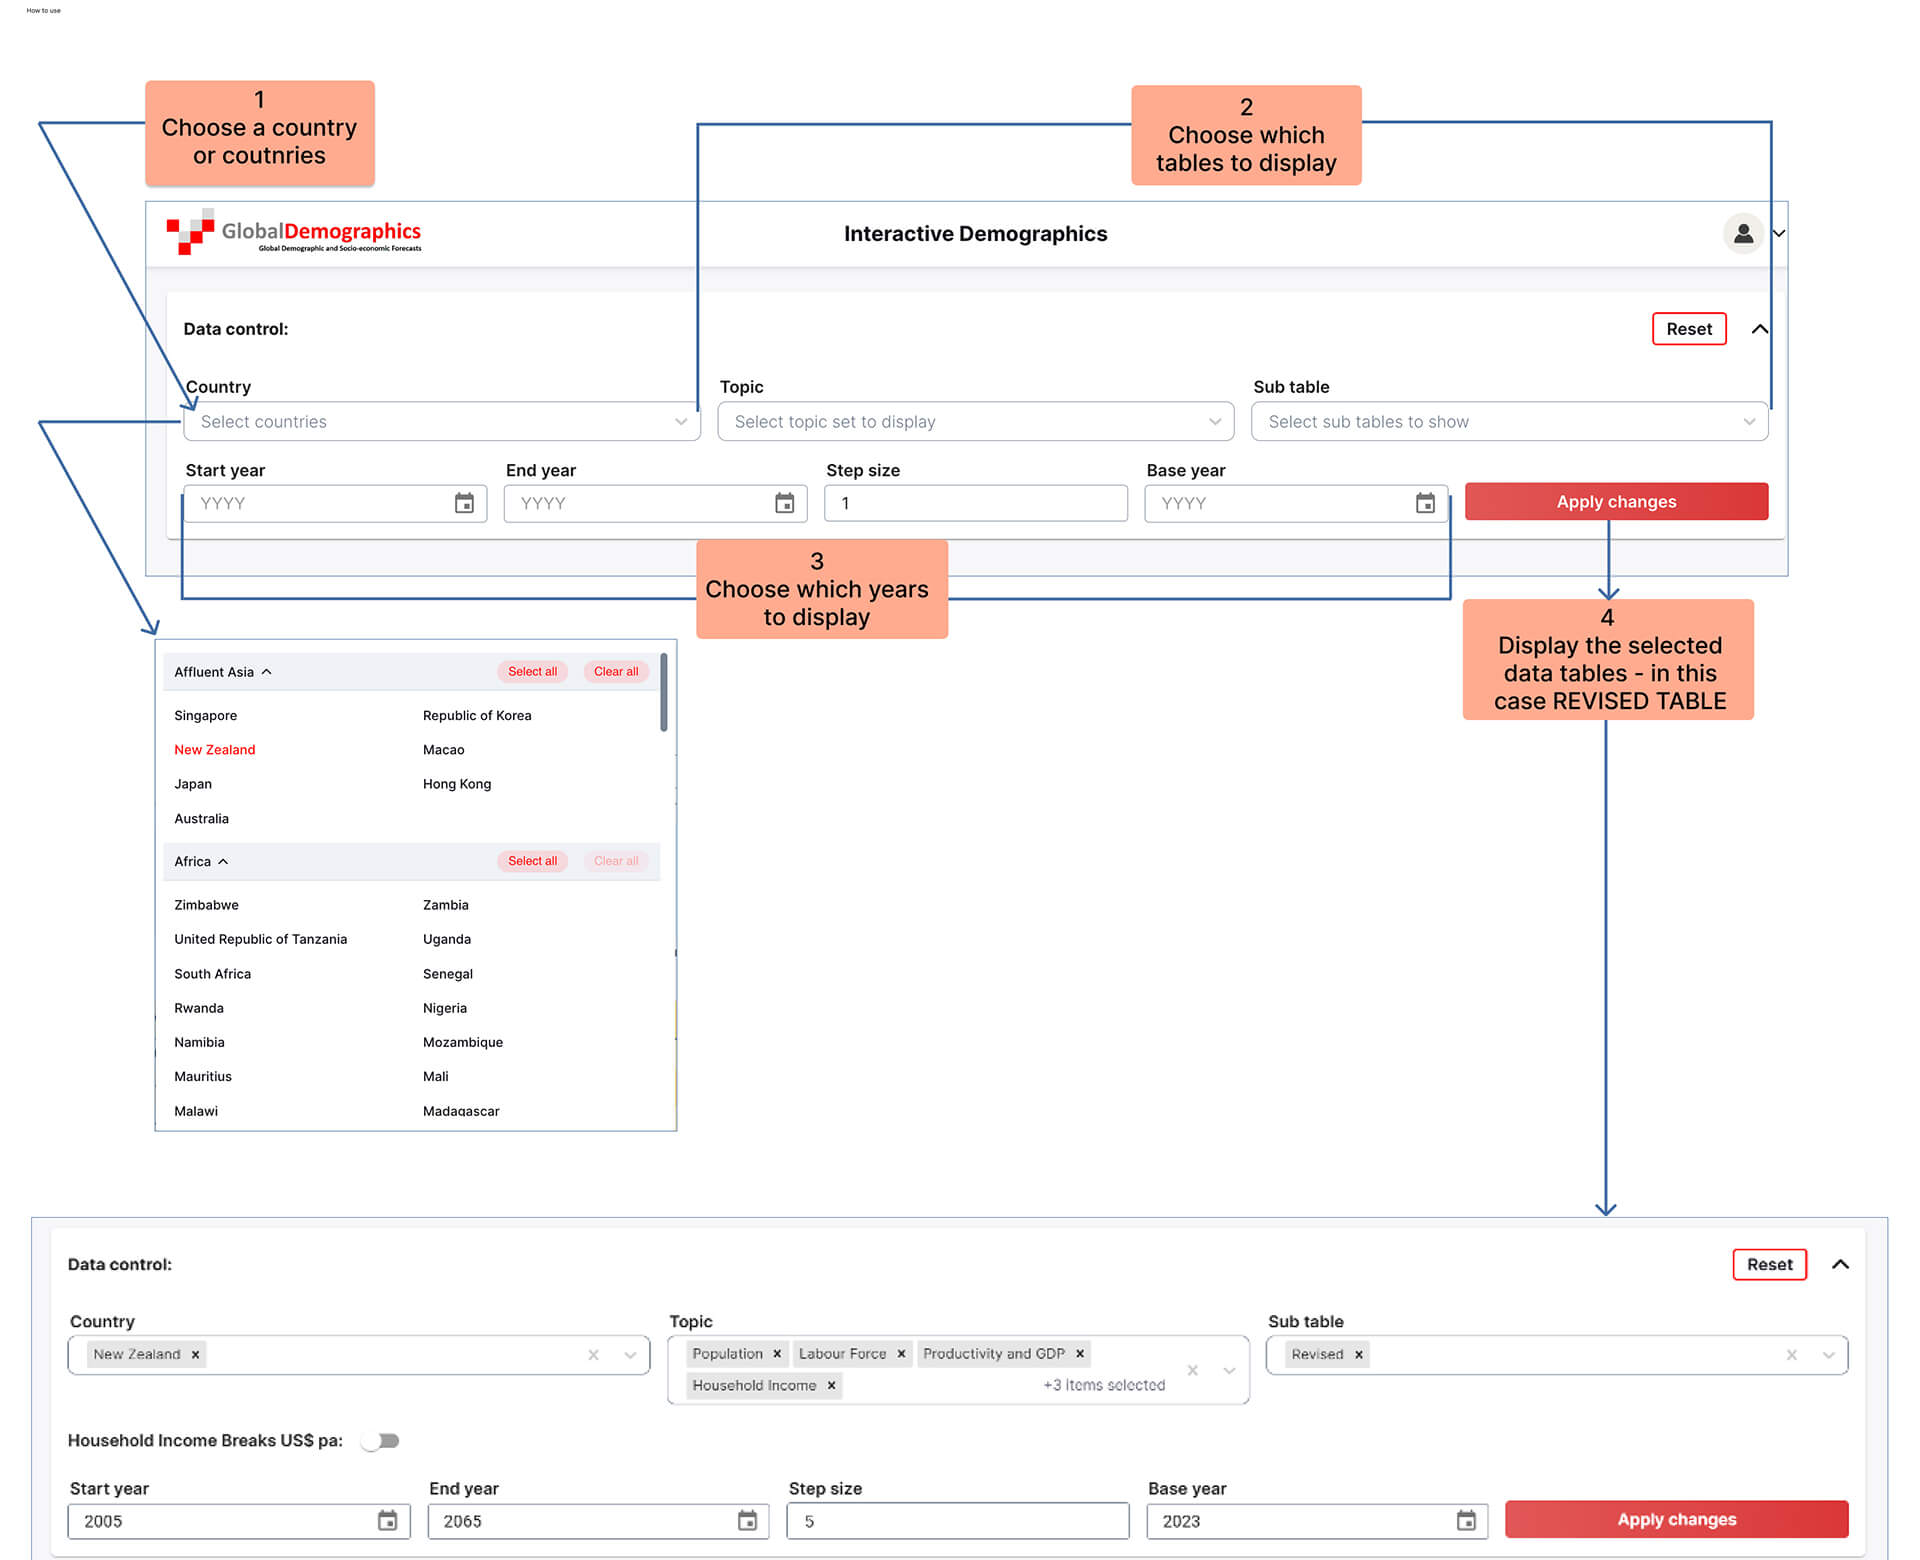
You can select either
- one country or
- as many as you like simultaneously, in which case the program aggregates them for the analysis. For example – if you choose all of the Western European countries, the total population figure will be the sum of the population of all those countries.
You can run as many different countries as you like throughout the session.
By selecting ‘Update Data Used, ‘ any existing country data you were using is replaced by the new selection, including the revised scenarios.

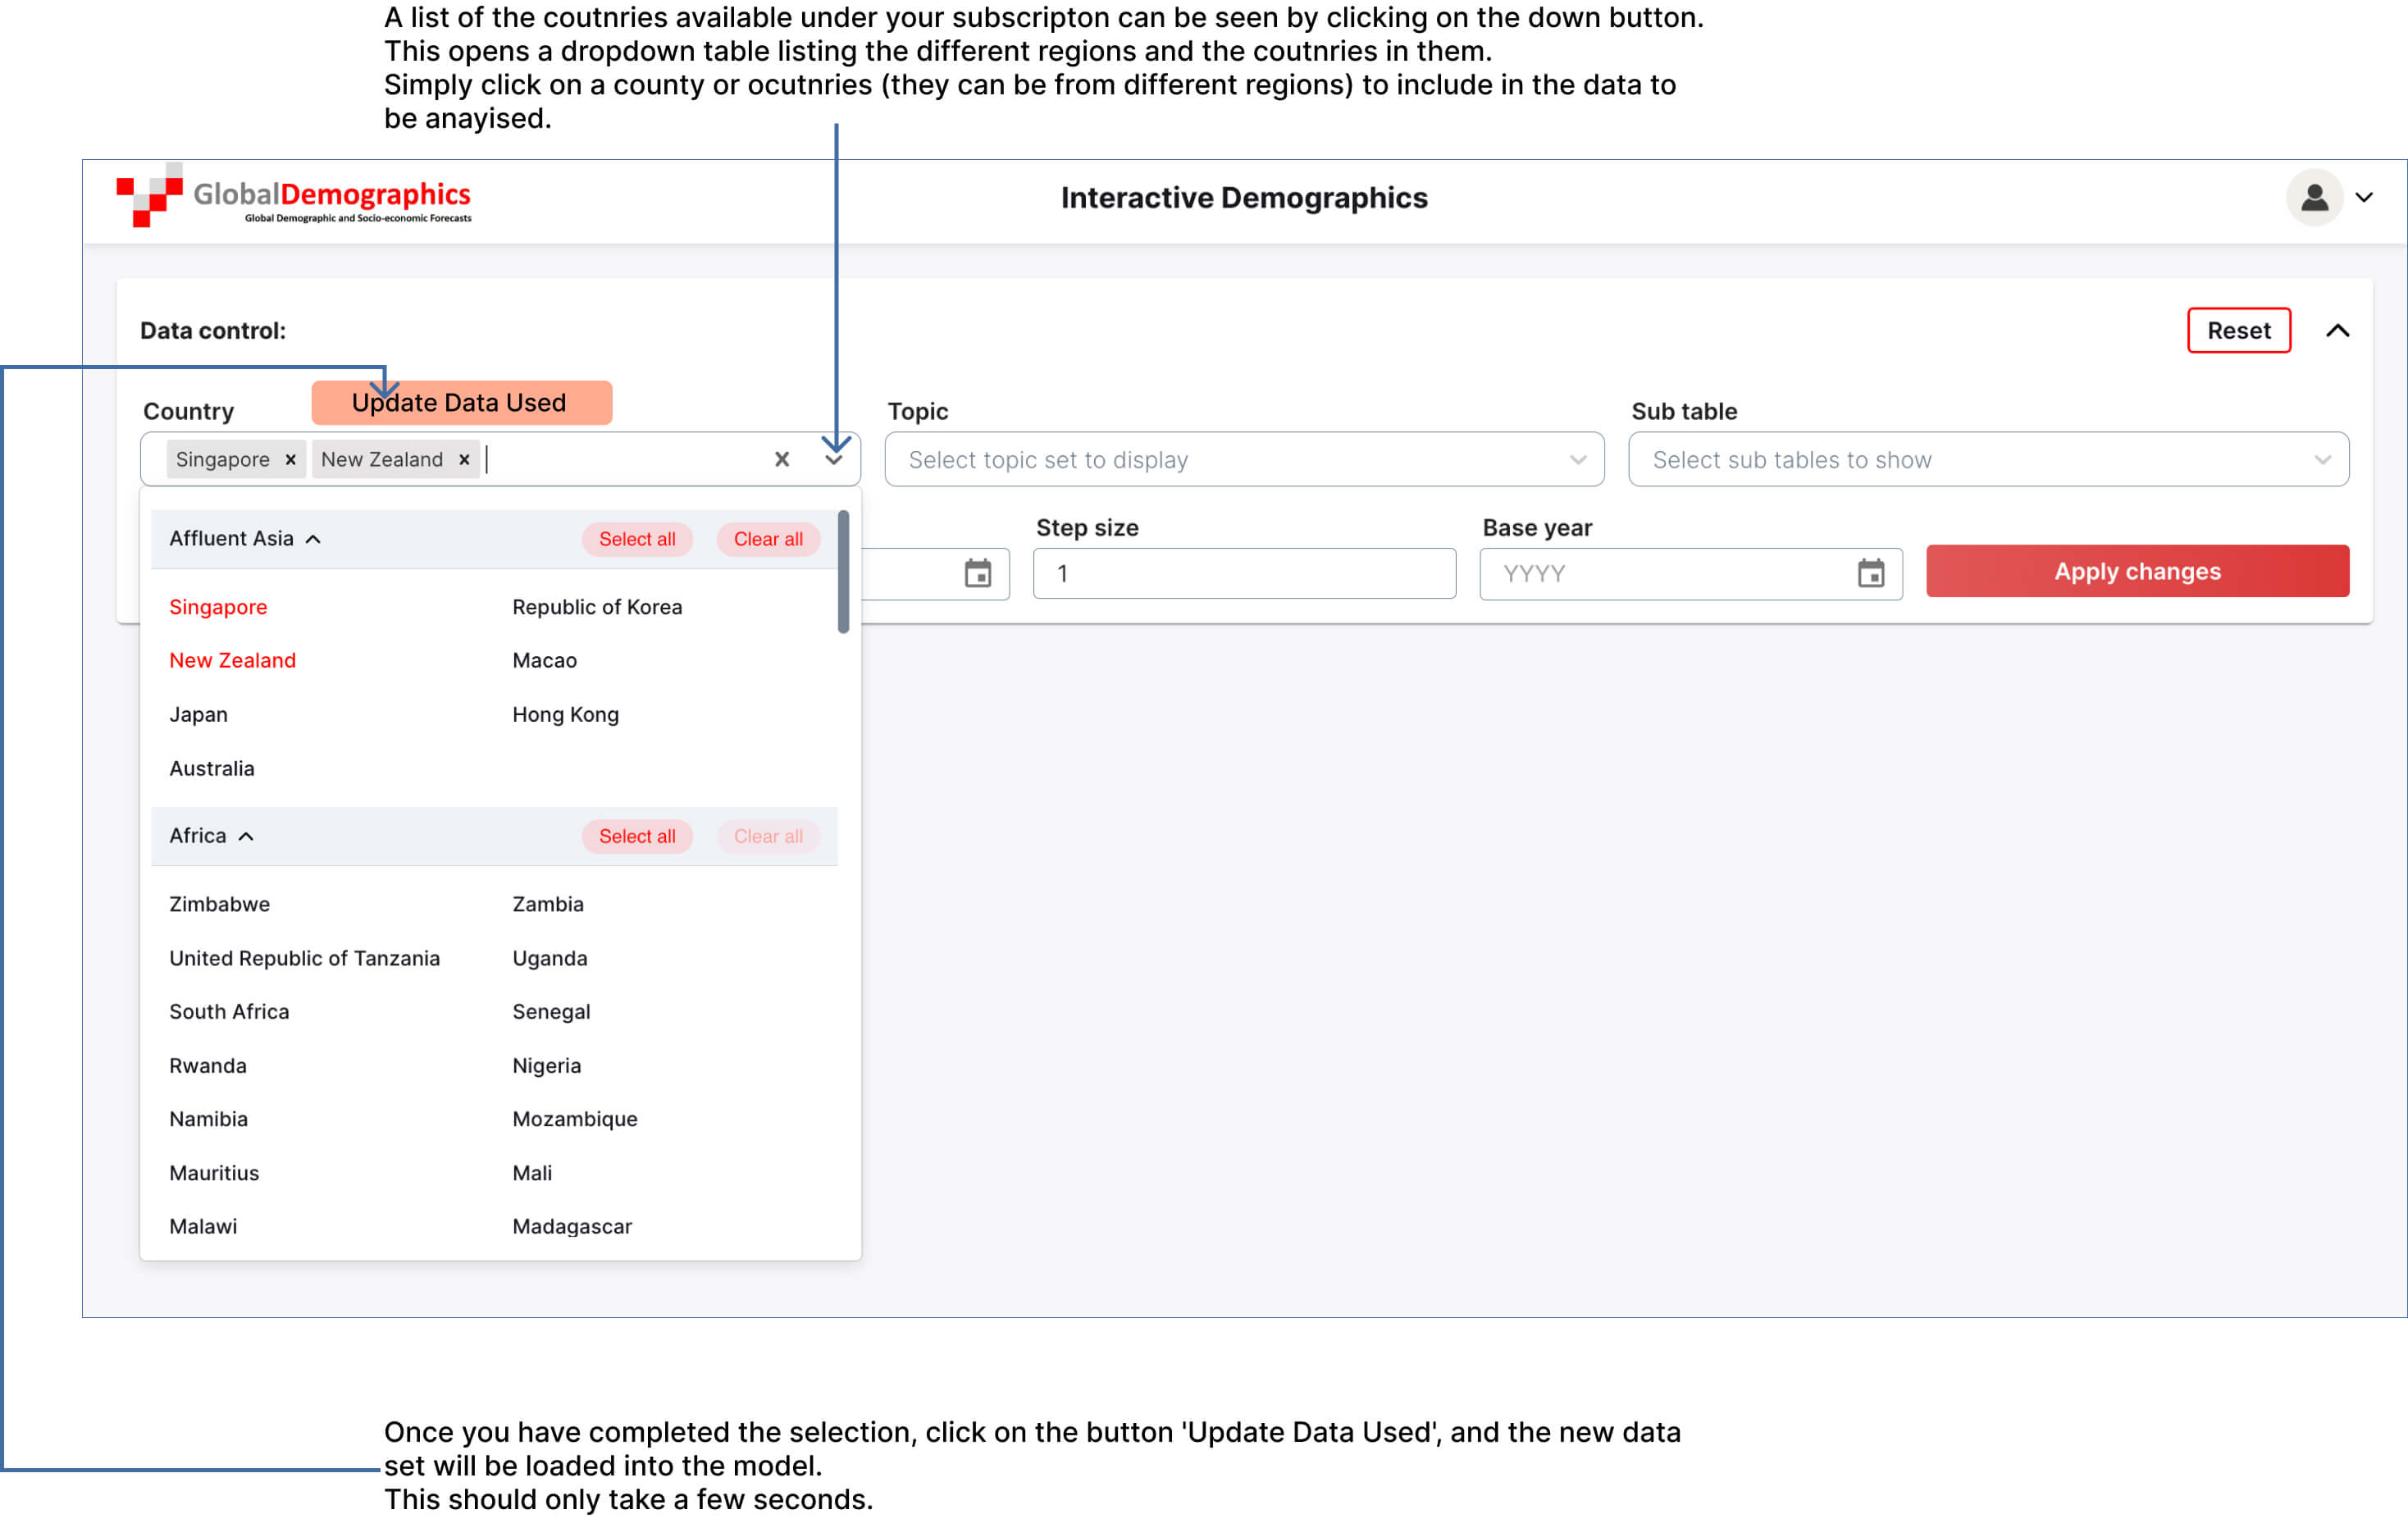
IMPORTANT: These display options only impact what appears on your screen. You can alter the specifications during the analysis at any time.
The program always analyses for all years and all variables.
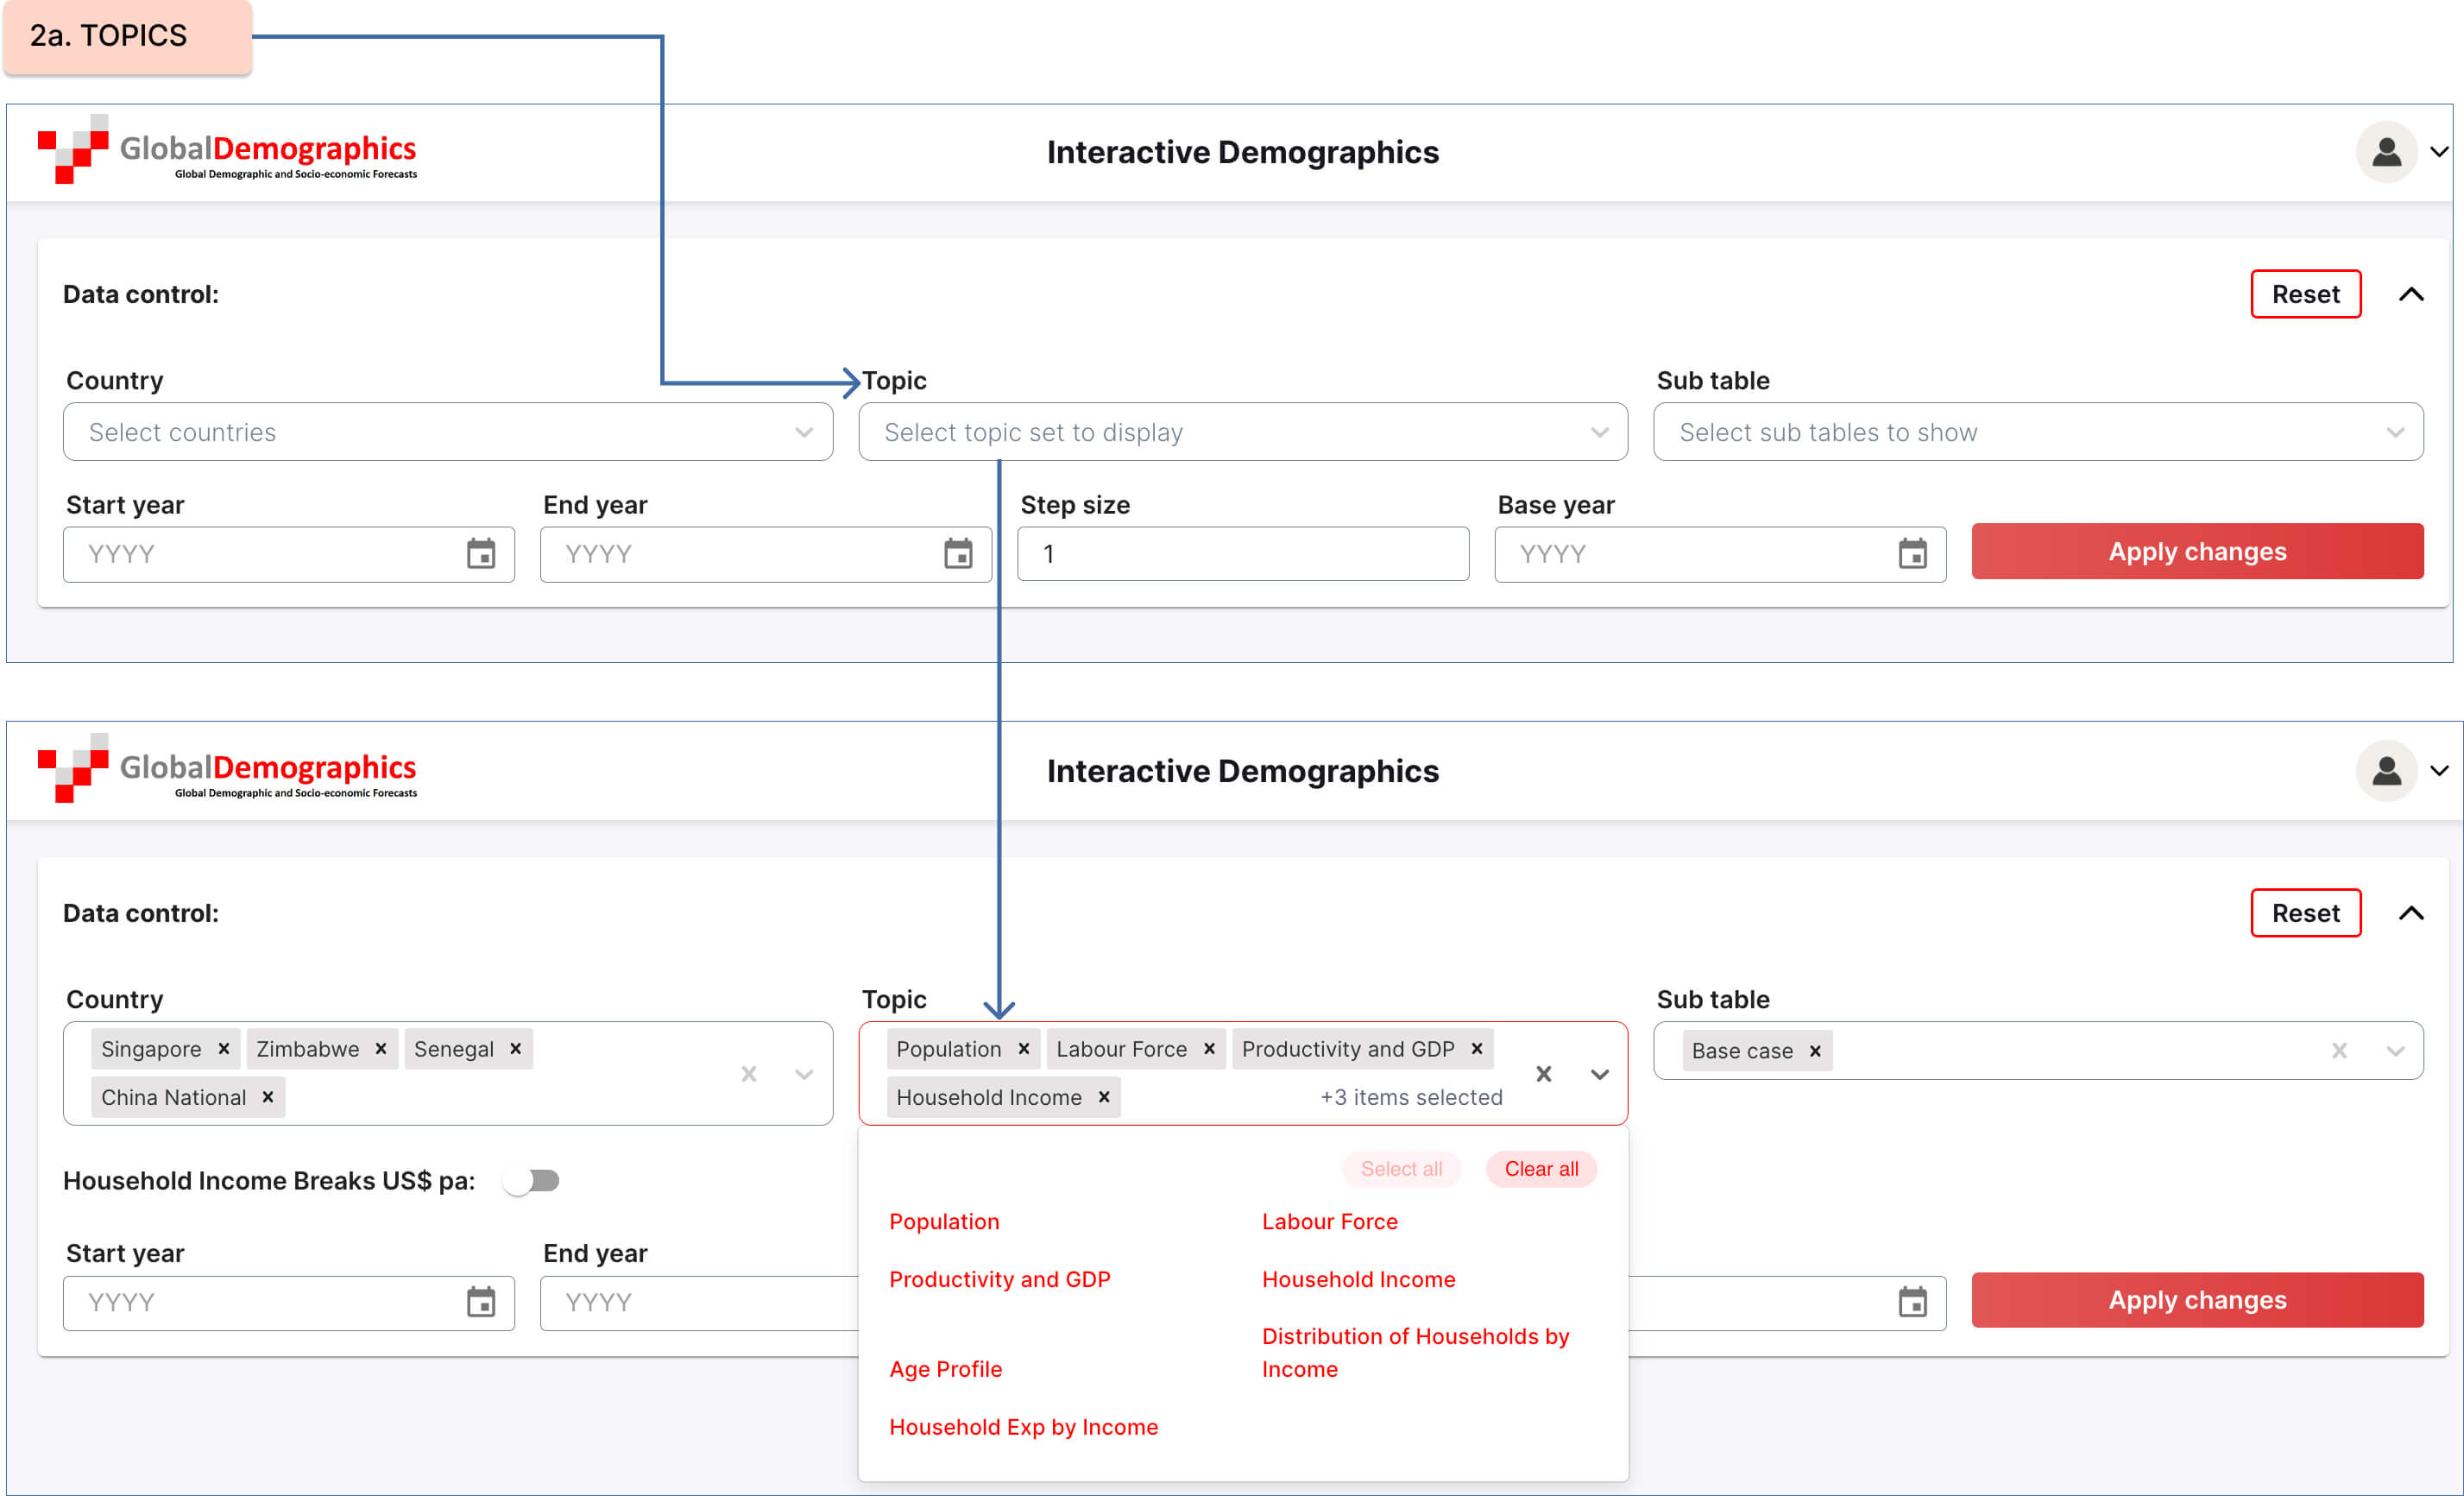
TOPICS: The data set is divided into the following topics
- Population
- Labour Force
- Productivity and GDP
- Household Income
- Age Profile
- Distribution of Households by Income Group (user-defined)
- Household Expenditure by Income Group – repeated for each of the 5 user-defined income groups: Note: Not available when more than one country is selected.
You can select any number of the Topics at once – but you must select at least 1,
Tip: Better to select 1 or 2 at a time – less scrolling. You can close them and open other ones at any time.
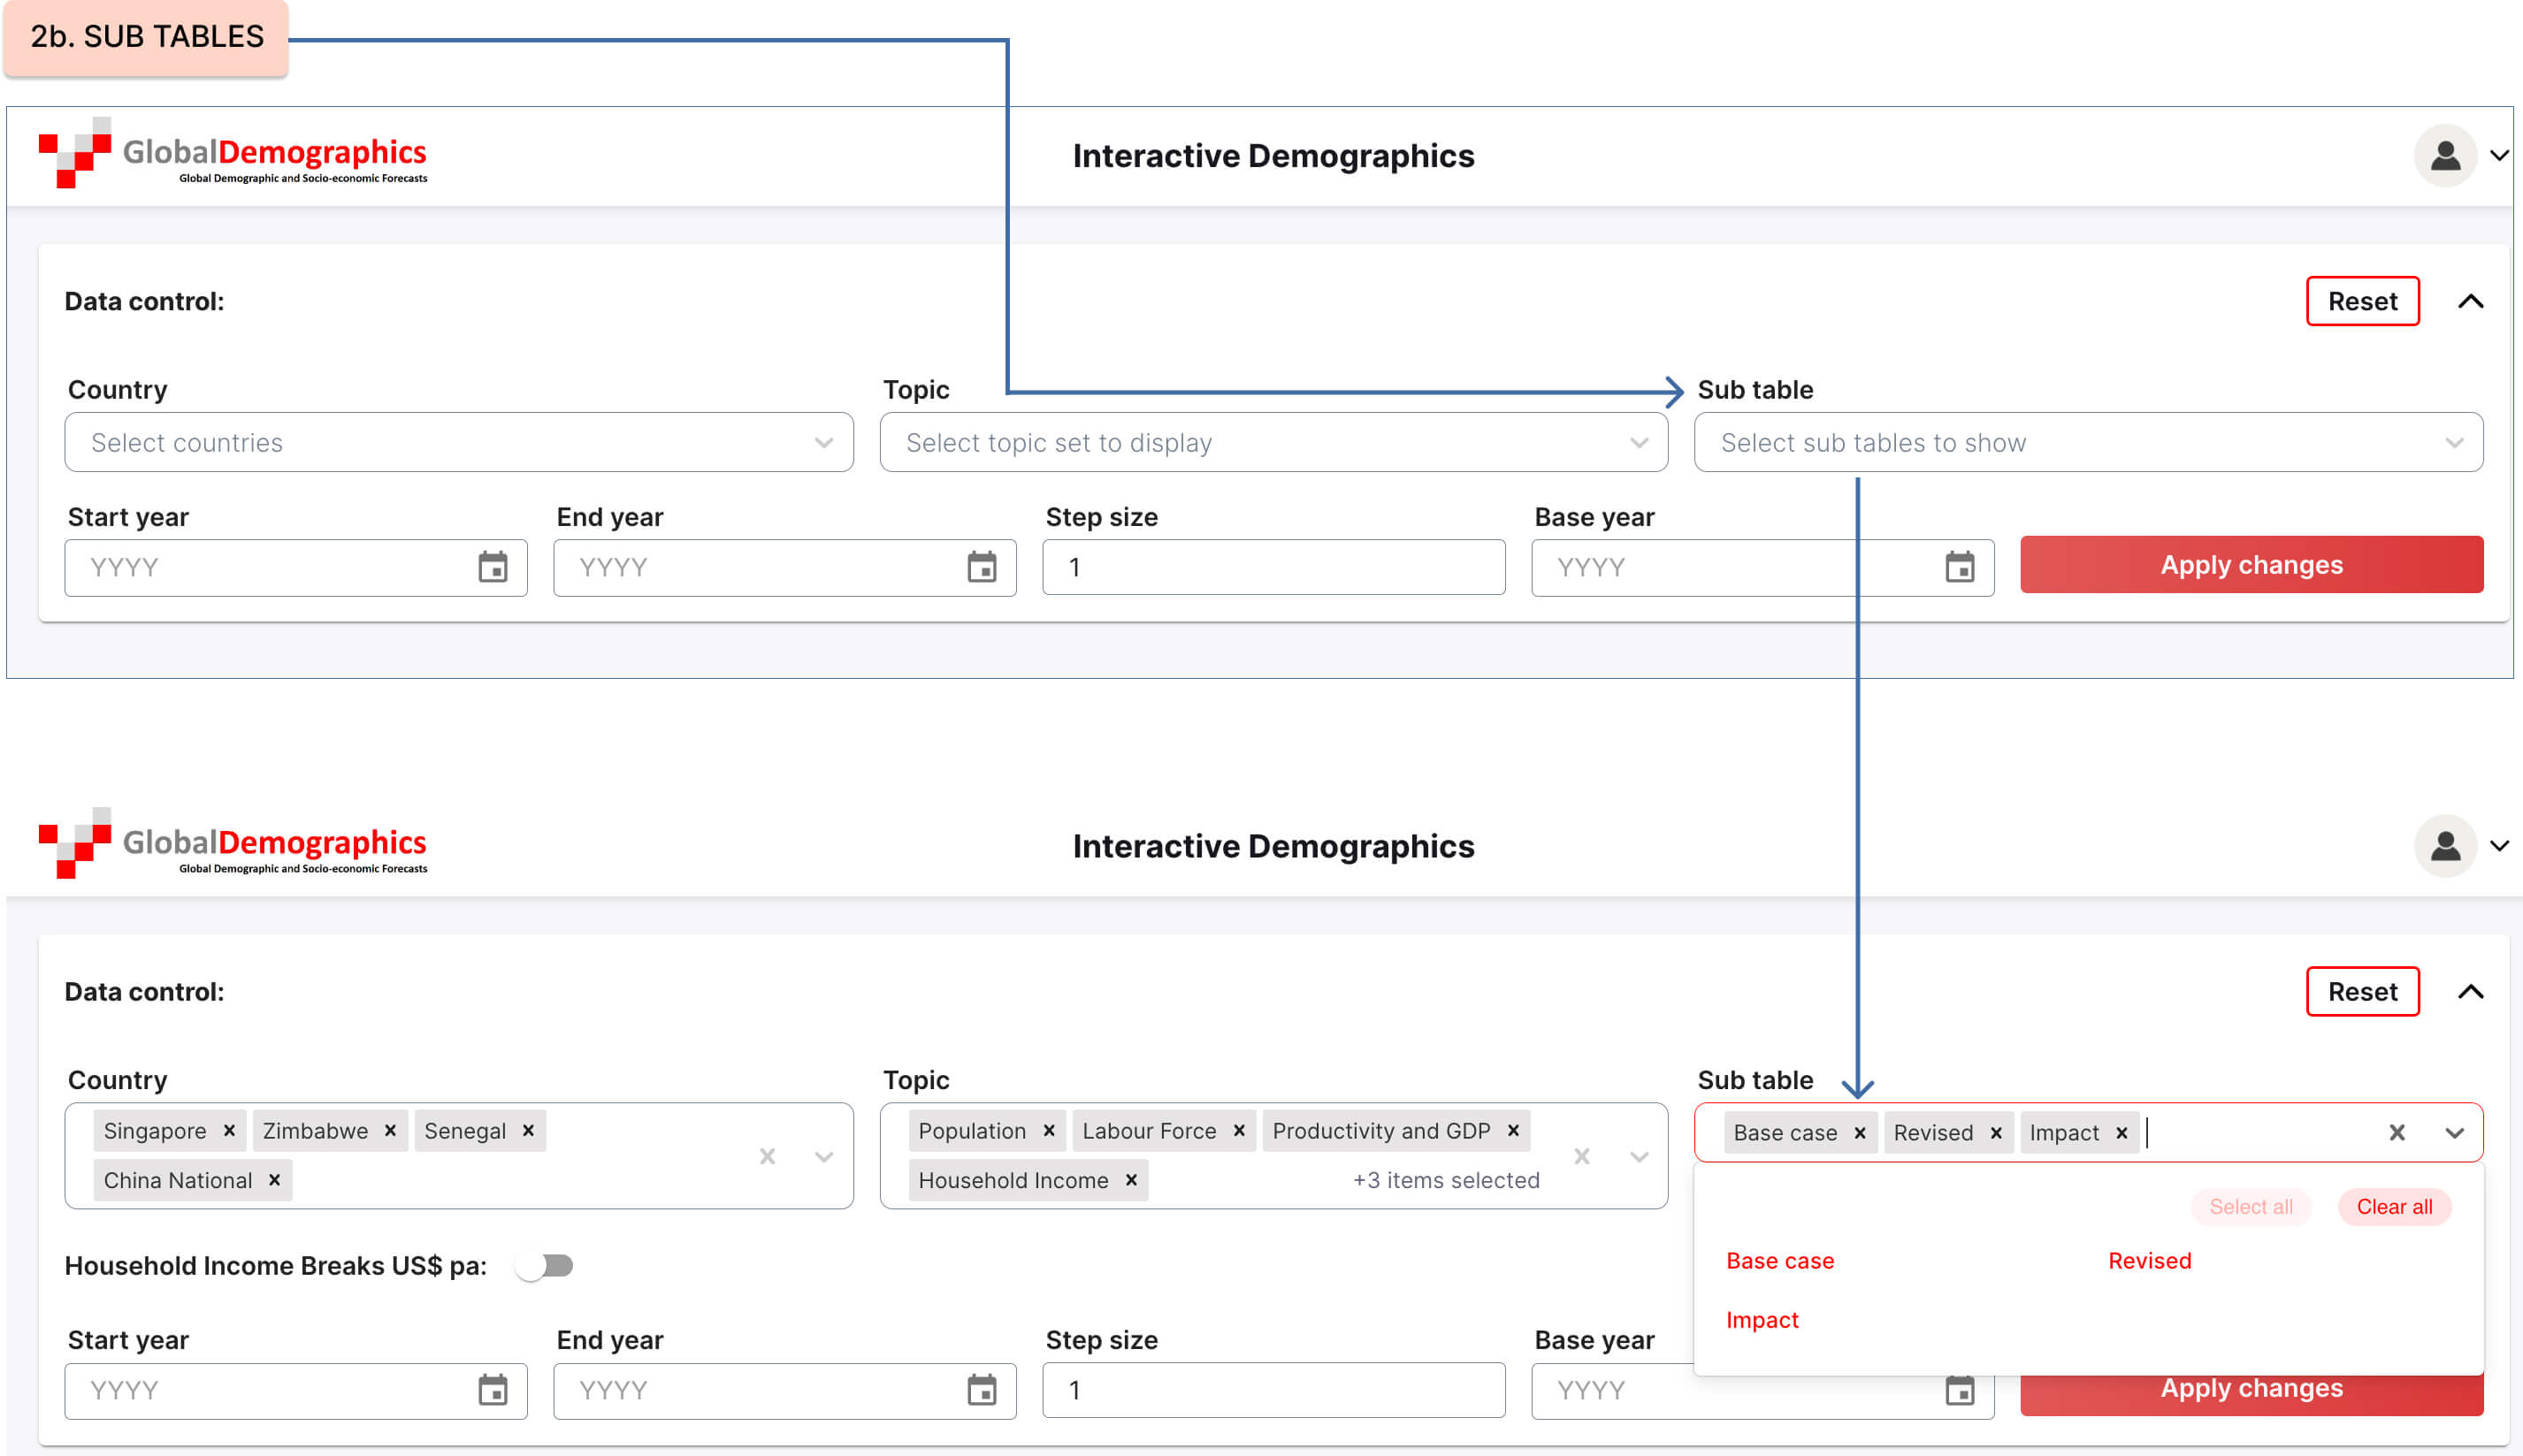
For each TOPIC, three sub-tables exist
- Base case
- Revised case (as a result of changed assumption made by the user – e.g. future birth rates)
- NOTE: You must select this to change or view a variable’s trend graphically.
- This table also contains ‘tool tips’ explaining the variables.
- Difference Table (Between Base Case and Revised Case)
Again, you can change this selection anytime during the same analysis.
However, the same selection applies to all Topics.
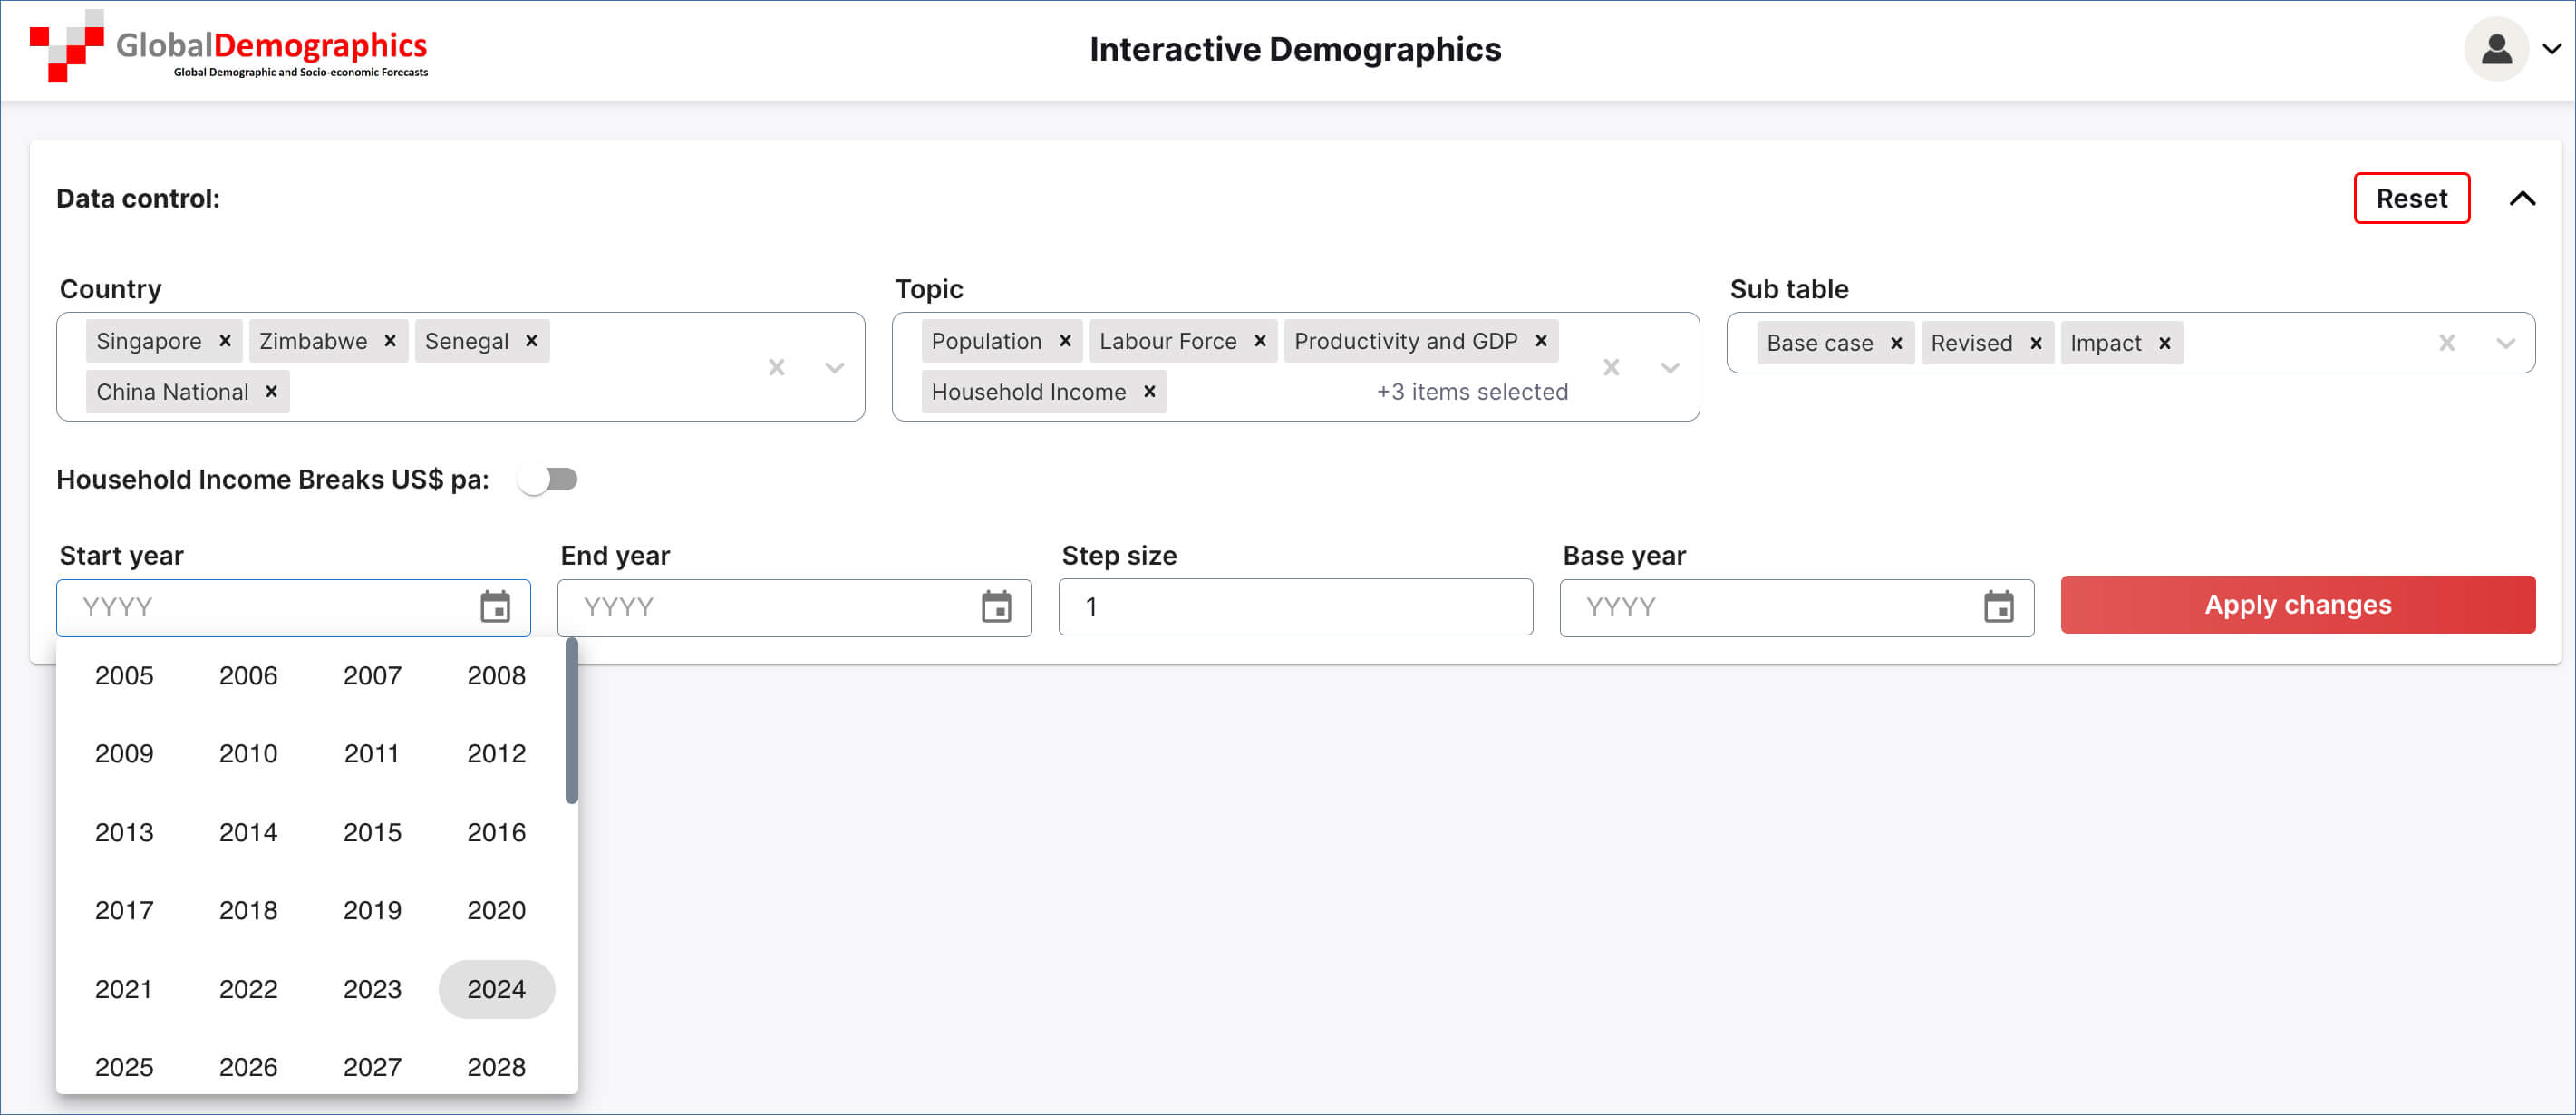
The data set runs from 2005 to 2023 actual, and from 2024 to 2065 forecast.
In total, that means 60 columns of data which is typically too much for any one computer screen. You can, therefore, select which years to display so that the critical years are shown.
Again – note the model solves for all years – you are simply selecting which ones to display. You can change your selection at any time within the same analysis
Step size – allows you to display every nth year on either side of the base year selected.
For example, if you select 2023 as the base year and a step size of 5, the model will display 2008, 2013, 2018, 2023, 2028, etc.
You can change this selection at any time by clicking the ‘Apply Changes’ button.
This simply changes the data displayed – not the solution.
Click this button to load the data of the selected country (or countries) and display it according to the parameters specified.
NOTE: If you subsequently only change items affecting the display (ie anything other than countries selected) the button will revert to ‘Update Data Display‘ and clicking it will only change what is displayed. For example you can change the year range displayed without reloading the data and scenarios.

The variables that cannot be directly changed by the user can be identified by the label on the button beside them in the ‘Revised‘ table.

These variables change due to changes in other variables, and it is typically not logical for the user to change them directly.
For example – You cannot directly/arbitrarily change the number of 15 to 24-year-olds in a particular year. It is a function of the number of 14-year-olds entering this year and the number of 24-year-olds leaving this year (including the migrant age profile) plus an allowance for deaths.
It is best to consider these non-changeable variables as ones a politician could not arbitrarily change.

Variable definitions

In the REVISED tables, each variable has a (?) beside them. Click on that icon to see a brief description of the variable and what it impacts
Variables that can be changed have a ‘change’ button beside them
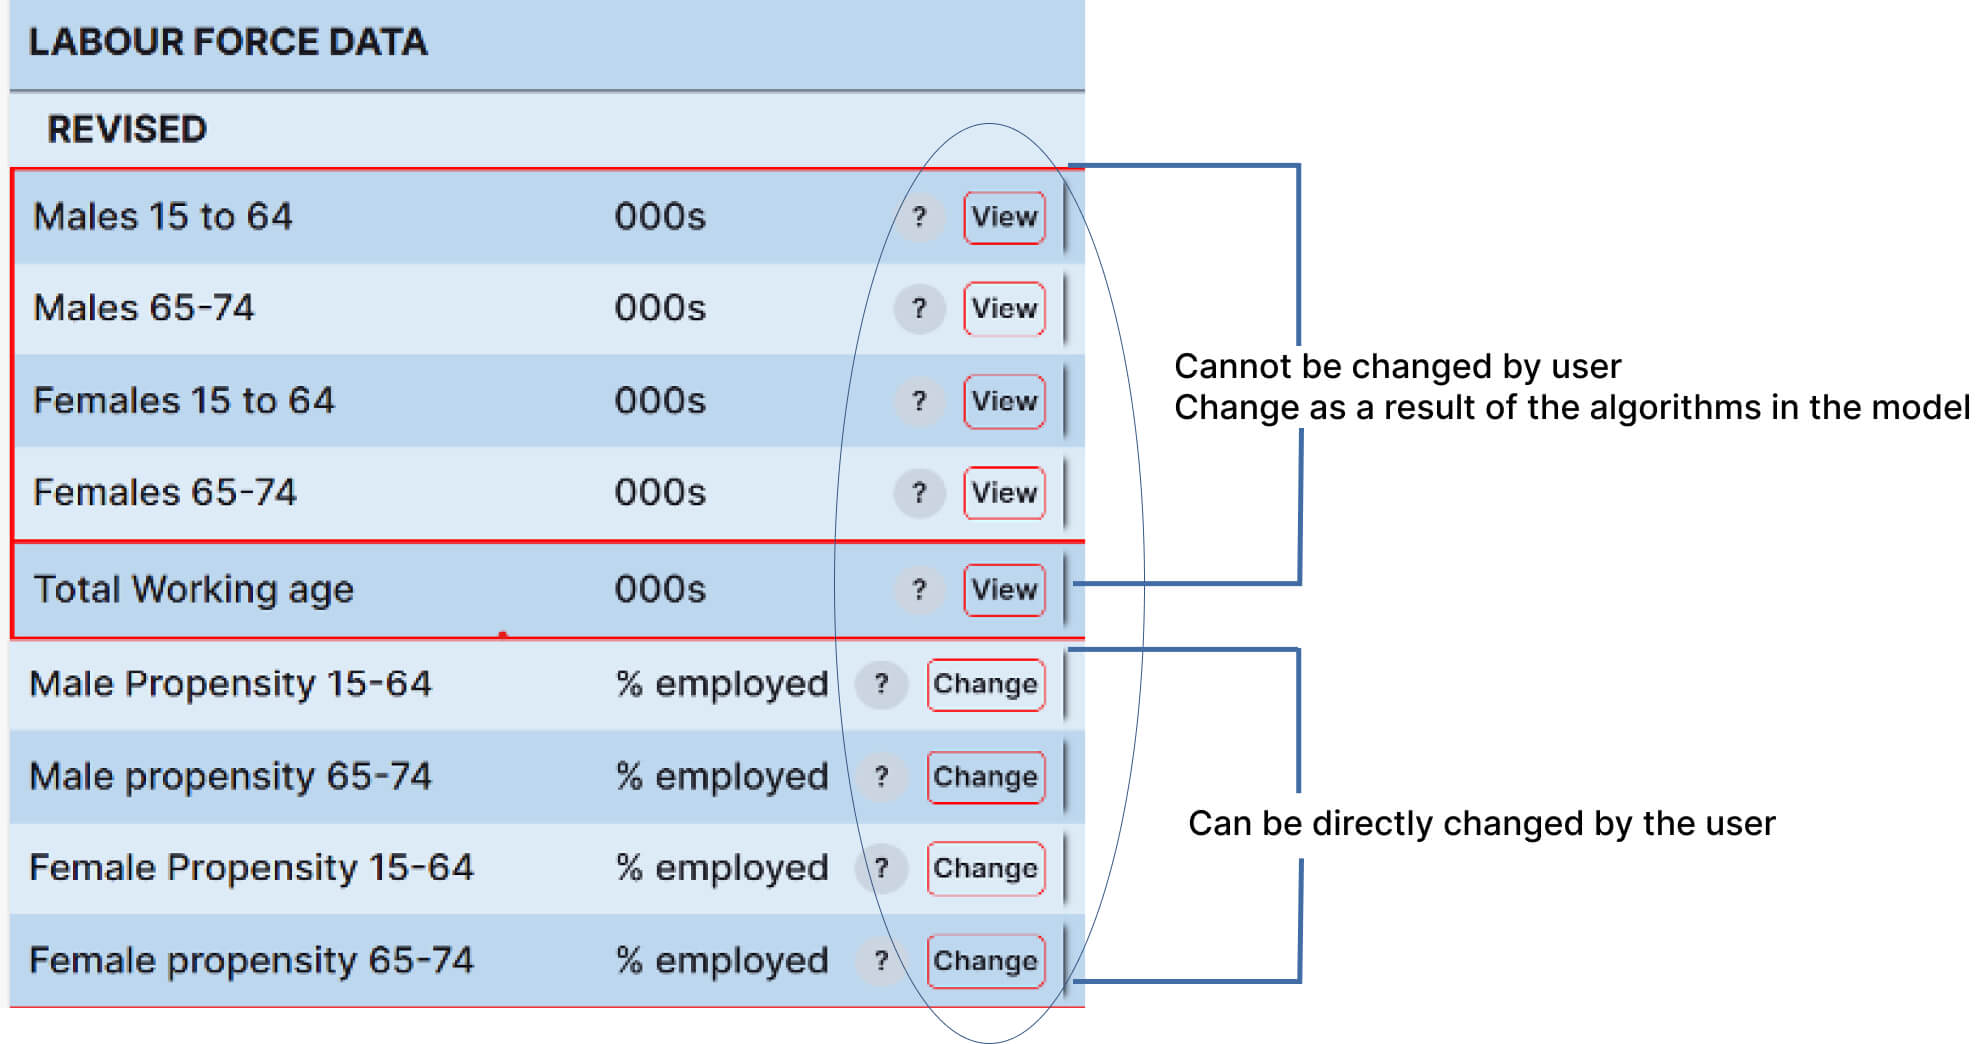
The variables you can change are
- Birth rate
- Migration rate
- Propensity of working age to be employed – by age segment and gender
- Fixed Capital Investment per worker
- Education index
- Gross Domestic Product per worker (Productivity)
- Wage ratio (proportion of productivity that reaches the worker
- Propensity of households to spend
- Median income as a percent of average income (disparity of income distribution)
Note: you can only change them for future years (currently 2024 onward)
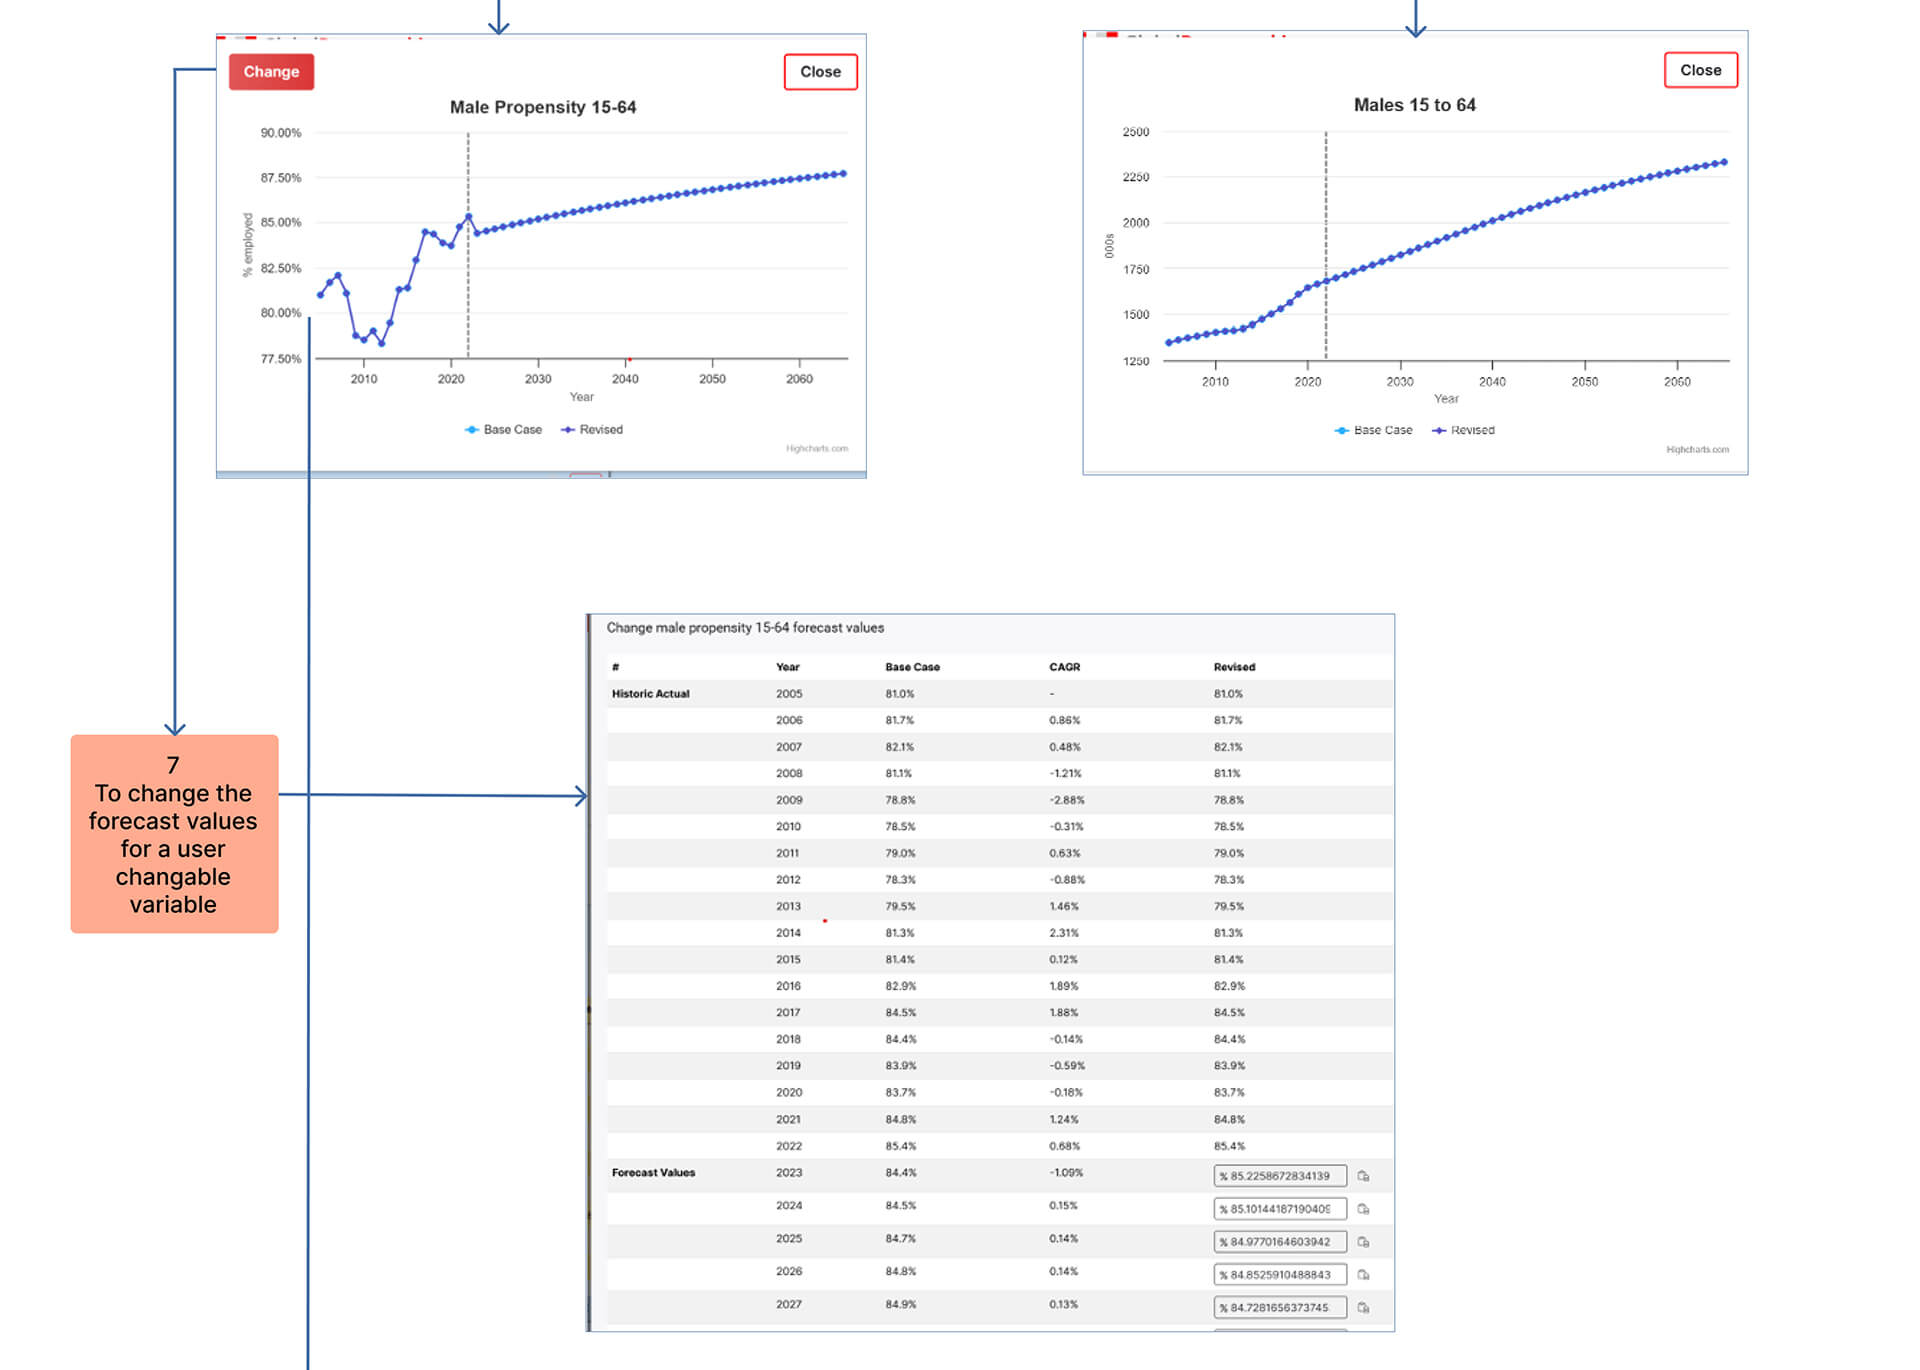
To change a ‘changeable variable’ click on the button next to it.
That will open a small chart showing the state of the variable from 2005 to 2065
If you have already made changes to this variable then both the base case and revised case will be shown
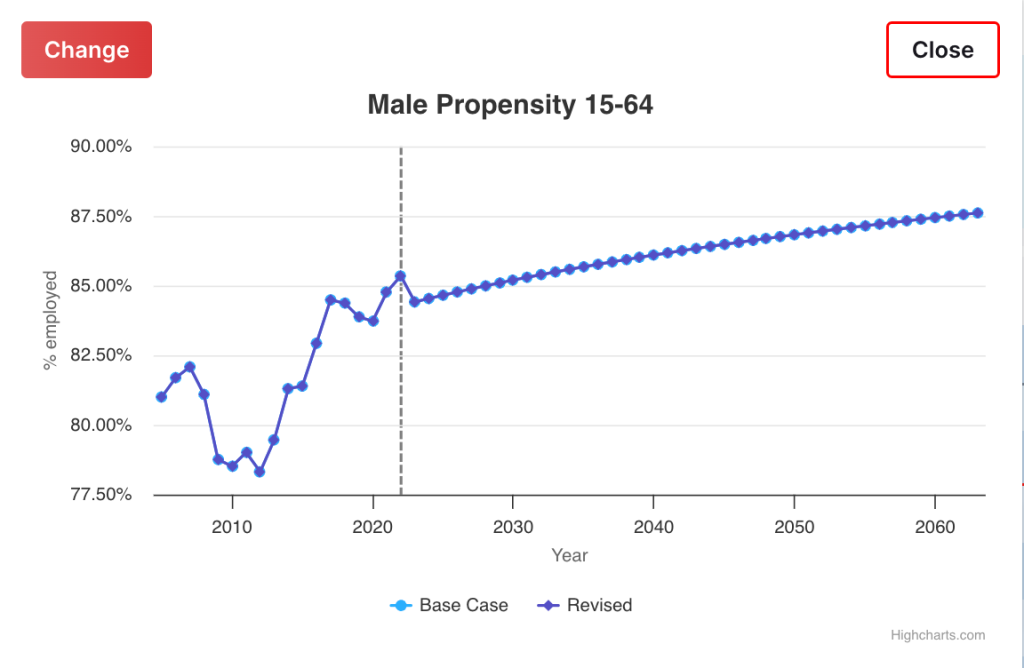
If you wish to change the values of this variable, click on the ‘change’ button at the top left.
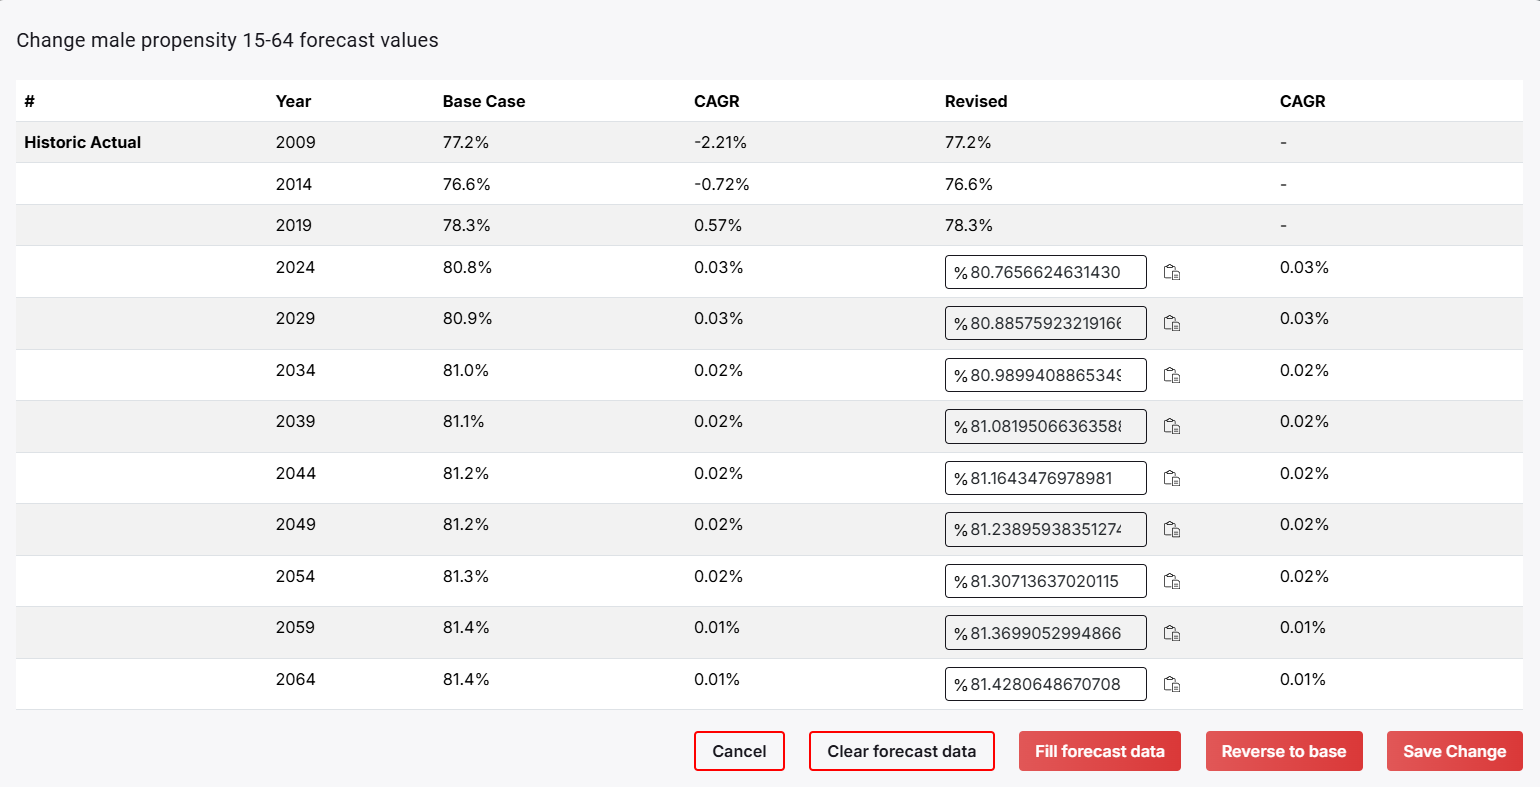
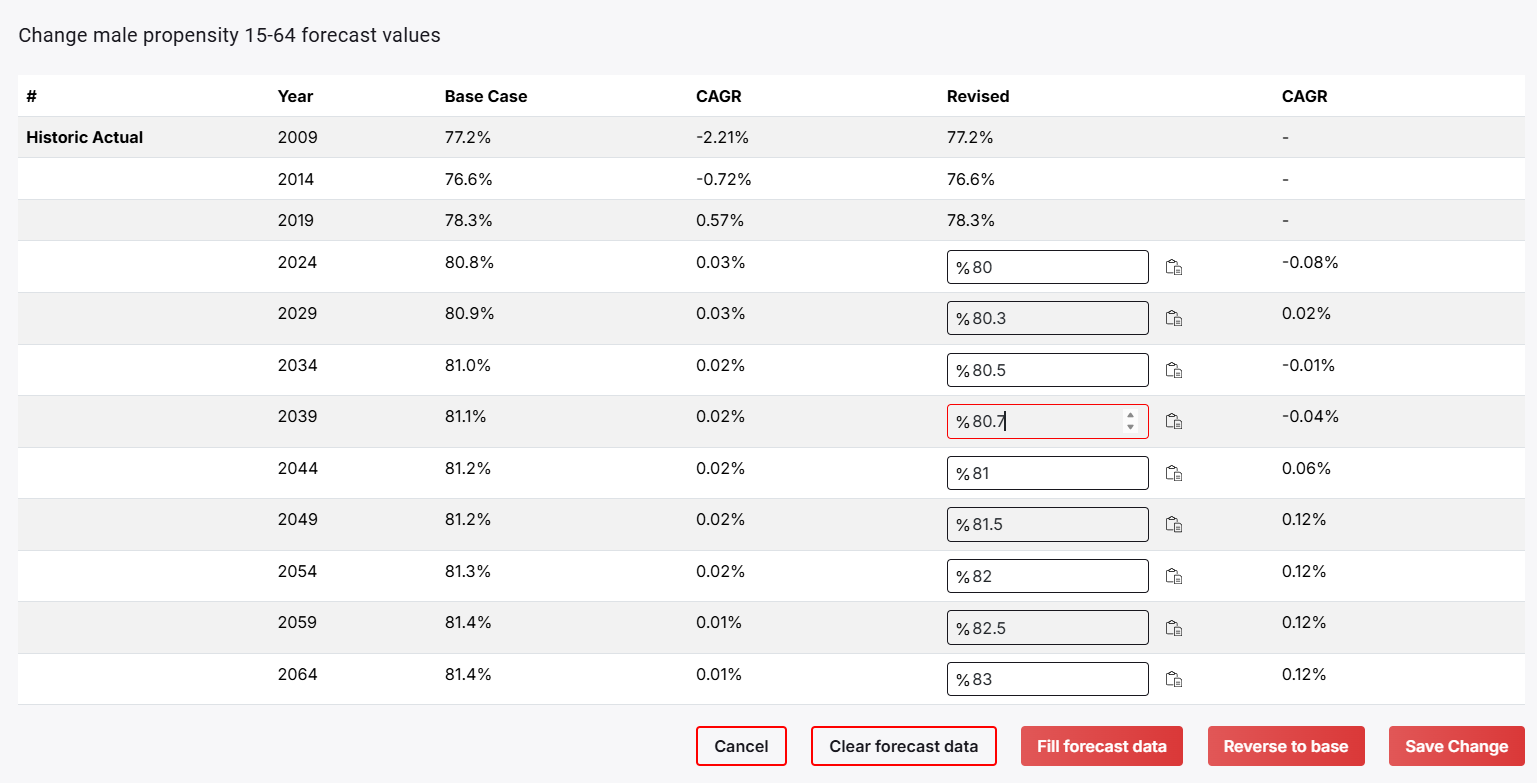
This will take you to a table, as shown below, where you can enter new values. Note that the table only shows the years you selected to be displayed (in this case, ‘Stepsize’ has been set to 5).
Initially, it shows the existing forecast values. Press clear to delete them.
Then, enter new values for the years you want. You do not need to enter a value for every year shown. The model will fill in the value for intervening years using a linear trend between each displayed year.
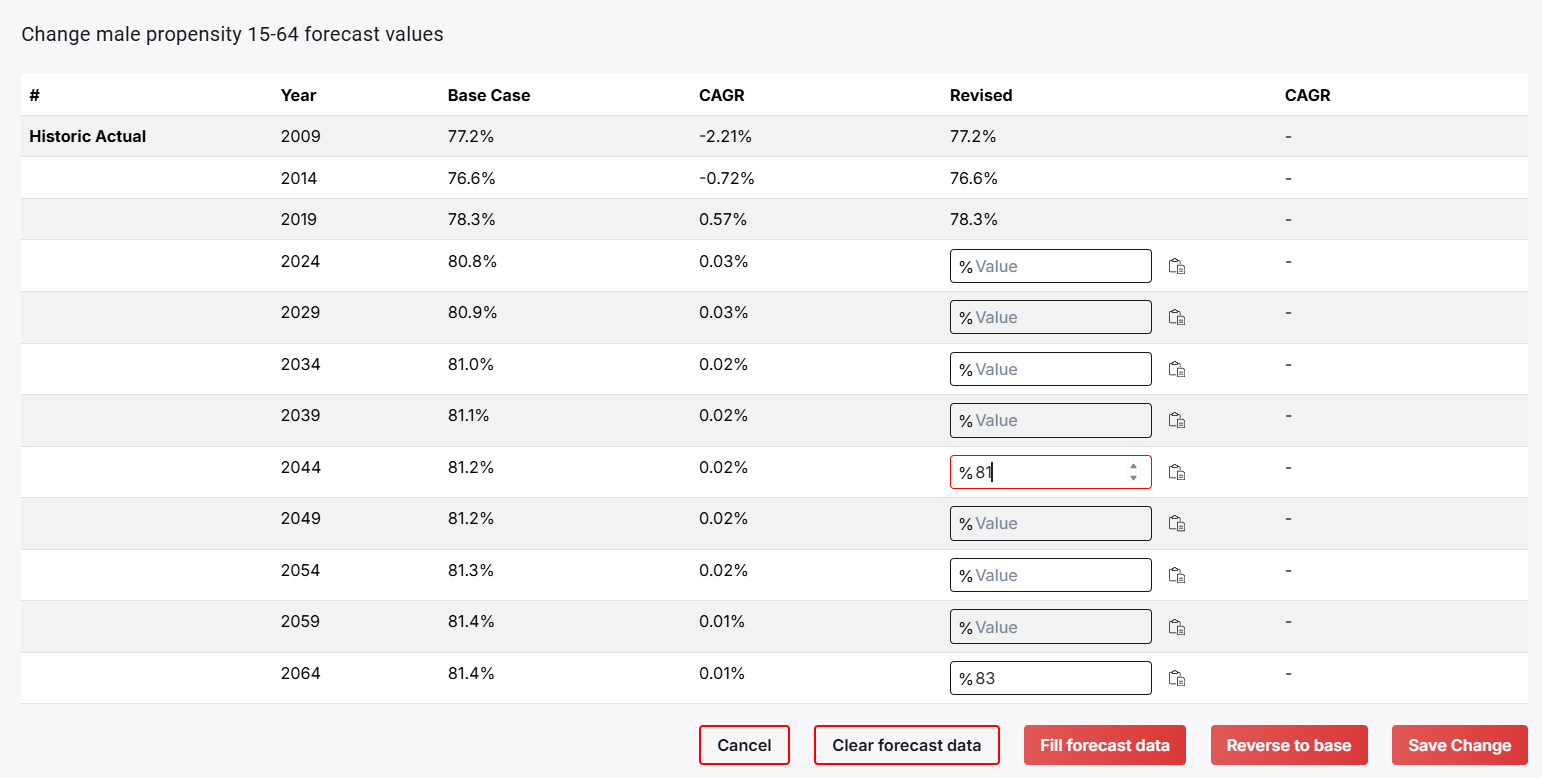
When you have entered values for the years you wish to use, click on the button ‘Fill Forecast Data’. The model will then fill in the intervening years using a linear trend between known points.
You then have three options, as shown by the buttons at the bottom of the table.
- Cancel – no change is made, and you are returned to the main screen.
- Clear the forecast data and enter different values
- If you are satisfied with the values shown, select save change, and the new values will be written to the underlying database for further modelling.
This option also displays the chart, but now with both the original data set and your revised forecast. This is a useful check on the extent of your changes.

If satisfied, then click on the ‘run new scenario’ button at the top right of the tables. The tables will be recalculated using the new values for the variable or variables you have changed. The solution is normally very quick.
Note: You can change as many variables as you want in a single session or incrementally over a number of sessions. That is change 1 variable – see the effect, then change another variable (but also leave the previous one as changed) and see the incremental impact of that, etc
NOTE: To see the impact of the changes, ensure you have the ‘REVISED’ tables selected as output tables. This is done in the Data control box
This will reset to the base case values for all tables (Base and Revised)
You can download an xlsx file at any time.
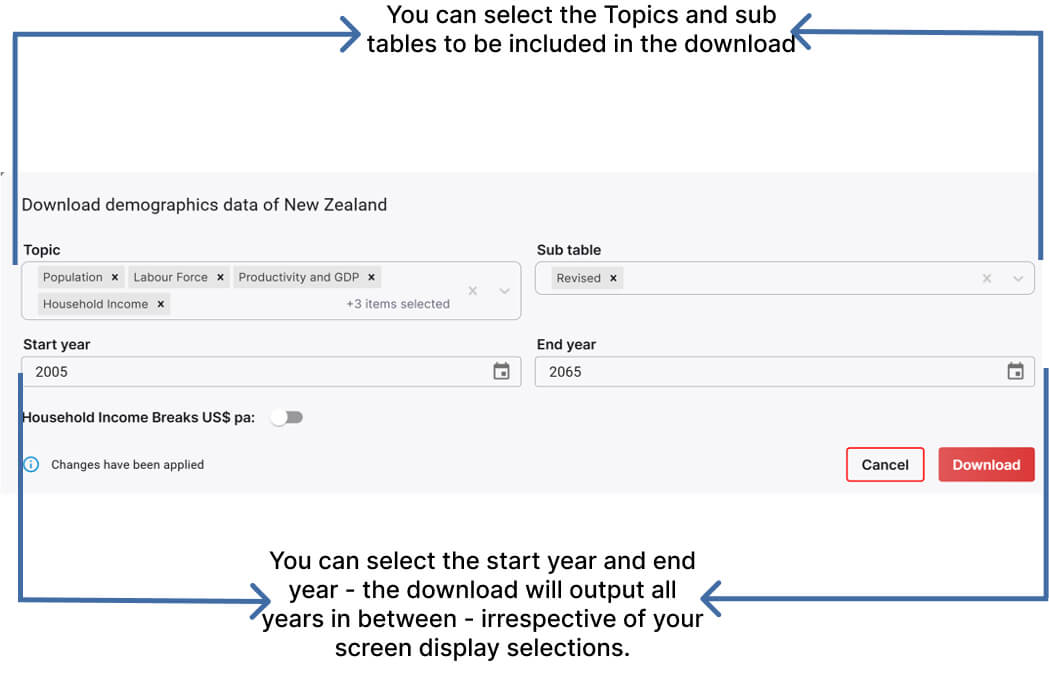
This applies to the last two tables in the main table – that is
- Distribution of Households by Income Segment
- Household Expenditure by Income Segment
If either or both of these TOPICS are selected in the Data Control area, then a new option appears for the user to set the income breakpoints.
Turn this on by moving the slider, and then enter the breakpoint for each of the 4 lower income segments by clicking on the ‘+’ sign and entering the break value.
Alternatively, the program will set breakpoints around the average household income


