


Overview of the Interactive Demographics Model
The diagram below shows the overall structure of the model

- As detailed below the user can change each of 12 variables - the ones where the box is highlighted in Green.
- These are all determinant variable which can be influenced in the short term by government or society attitudes.
- The nature of the other variables is very much a function of the state of the determinant variable (For example, the size of the labour force is a function of the working age population and propensity to work - the latter being a determinant variable).
- Having changed the variable and pressed ‘run scenario’ all variables affected are changed and highlighted in yellow - so you can quickly see the breath of the impact of that change.
- You can also see the detail pattern of a variable for the years 2007 to 2043 by pressing the ‘change’ or ‘detail’ button by each variable.
This figure shows the total schema - but don’t be put off - it is easy to read and use. You can zoom in on specific areas

It really divides into 5 areas plus navigation/selection area. You can zoom in on each area by a click of a button.

To operate the Model there are the following steps:
STEP ONE
Load the data for a selected country and specify the years to be displayed in the above grid. (You can see the values of a variable for all years from 2005 to 2019 actual and as currently forecast for 2020 to 2045 by clicking on the button in the box for that variable).
STEP TWO
Alter the value of one or more of the twelve determinant variables (highlighted in Green). These are
- 1. Birth rate per 1000 women aged 15 to 49 years.
- 2. Migration rate as a percent of the total population in the previous year.
- 3. Participation rate of males aged between 15 and 64 years in the workforce
- 4. Participation rate of males aged between 65 and 74 years in the workforce
- 5. Participation rate of females aged between 15 and 64 years in the workforce.
- 6. Participation rate of females aged between 65 and 74 years in the workforce.
- 7. Fixed Capital Investment (US$ Bn) per annum.
- 8. Education Profile of the adult population.
- 9. Wages as a percent of GDP per worker (Basic Productivity measure).
- 10. Productivity trend.
- 11. Propensity of households to spend (% of gross income).
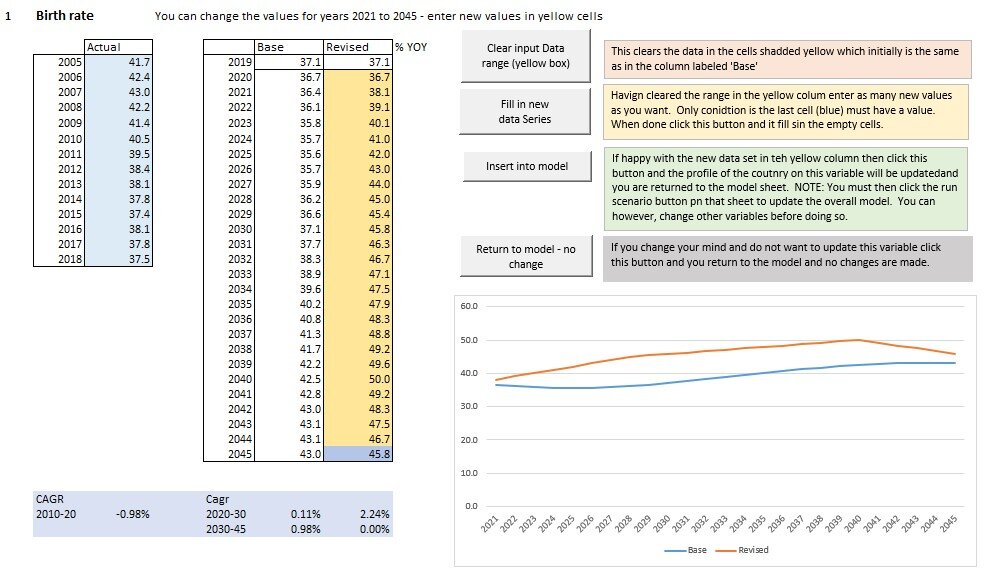
Clicking on the ‘Change’ or ‘See Detail’ button by each variable opens up this page with the historic and currently projected values for that variable. If the variable can be changed then the base values will also be shown in the ‘yellow’ area and this is where the numbers can be changed. (More detailed on this is provided later in this manual). Once new values have been entered then press the button ‘insert into model’ and the user is returned to the main screen with the underlying data updated..
You can also alter the household income break points used for the analysis of households by income, and their expenditure pattern to suit level of affluence of the country you are currently examining or your specific market definitions. There is currently provision for 5 income segments.
The value of the other variables are a function of what happens to the above variables. For example the number of women of working age for the next 15 years is already determined by the age profile of females alive today. Neither a government nor you can change that age profile in the short term - but by changing birth rates it affects it in 15 years time.
There is also provision to simply alter total real GDP and the impact of that change on other variables. In this instance the user sets the GDP growth rate and also the proportion of the change (positive or negative) that is accounted for by a change in total employed and thereby propensity to be employed (You cannot change the size of working age population in the short term). The balance of the change is allocated to productivity of the worker which in turn impacts wages and then household incomes. This option is provided as often the data available for forecasting is trends in total GDP and not the components of it that impact that trend.
STEP 3:
Having determined the changes from the base case and entered them into the model, Press the button ‘Run Scenario.
The model will recalculate the expected future values of all variables as a result of these changes. It highlights all changed cells in bright yellow for easy identification of the impact of the change(s).
The model is designed to re-solve from the base case every time - so you can change just one variable first - see the impact of that, then keep that change and also change one other variable and see the combined impact of the two changes etc.
You can start with a fresh solution by pressing the ‘Reset button’
STEP 4:
Interpret the results as described here.

Proceed to section on Loading Data
CONTACT US:
For bespoke analysis please complete the form below giving an outline of the type of information you would like to get, countries covered and time period covered and we will respond within 24 hours with a quote and time line.