


Epi, ability to pay willingness to pay model
Epidemiological, Ability to Pay and Willingness to Pay Model
Stage 3: Funding Environment.
NOTE: All financial data in this model and including this page is in Real 2019 values. To be clear, that is the effect of inflation has been removed and data for earlier years (for example) have been re expressed in 2019 values using the deflator for the country selected. This then makes the forecasts more reliable as they are expressed in present day values and the user does not need to make any assumptions about inflation in future. The changes that are shown are ‘real’ changes in value.
NOTE: All financial data expressed in US Dollar Values is the Local Currency expressed in 2019 values divided by the exchange rate shown at the bottom of the table on this sheet – ‘Funding Environment’ This is the average rate for 2018. As exchange rates can fluctuate considerable different rates can be made available on request.
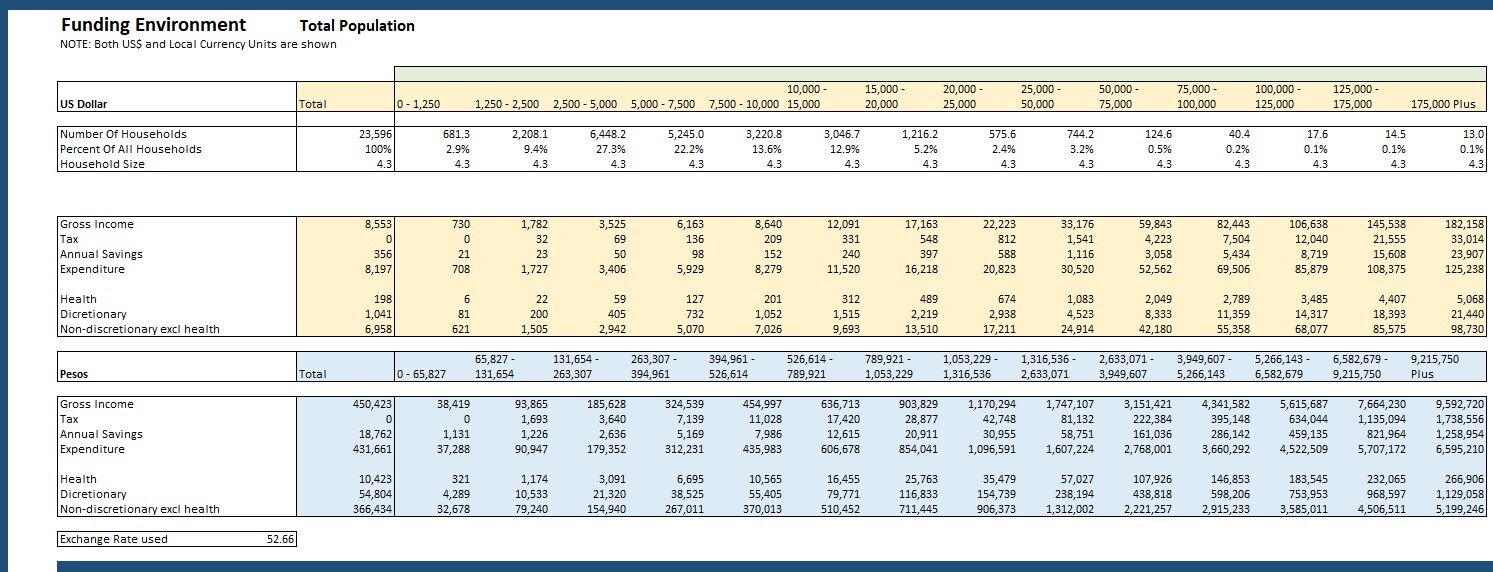
This Section gives the user a profile of the income and expenditure pattern of households in the selected country. It shows across 14 income segments (as well as total) the
- number and percent of households that fall within each income segment,
- the number of persons in the average household
- The gross household income
- The amount that goes in taxes
- The amount saved in the year
- total household expenditure in the year
- Of that what amount went to each of
- Health
- Discretionary expenditure (ie things that could be given up if needed)
- Non discretionary expenditure excluding health expenditure (which is also considered non discretionary).
The financial items in the table are shown first in US Dollars (to enable international comparison) and then in Local Currency. Local currency is the blue shaded cells and US Dollars in the yellow shaded cells.
The default year displayed is 2020 but the drop down box at the top of this table allows the user to select any other years in the range covered.
The Local Currency unit is named at the start of the local currency section (blue)
The exchange rate used for this analysis is shown at the bottom of the table
NOTE: Ability to pay
The table above provides key inputs for the ability to pay model and this is described in the next section of this manual
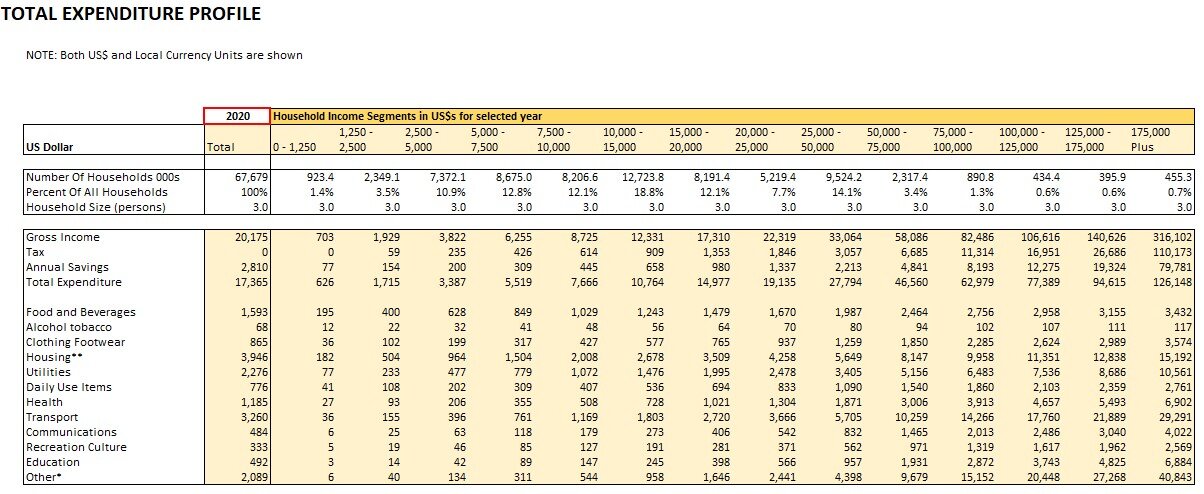
THEDETAILED EXPENDITURE PROFILE
At the bottom of this analysis there is a repeat of this table showing the twelve individual expenditure categories. The user again can select which year to display.
In the model his table is repeated in Local Currency.
GOTO THE NEXT SECTION OF THE MANUAL
By 2045
The total population of China is projected to decline to 1.378 billion persons – down from 1.411 in 2020 (Census). This assumes the average birth rate per thousand women aged 15 to 49 increases from 44 (in 2019) to 50 in 2024 and then declines to 46 by 2045, reflecting trends in improved education and affluence.
Annual births in 2024 are expected to be 15.7 million and are projected to decline to 12.4 million by 2035 and 11.541 million by 2045.
For more information on births in China, see our Special report on this topic
Learn More