


Epi, ability to pay willingness to pay model
Epidemiological and Willingness to Pay Model
Scenario Model 2 – Price-Volume-Value Analysis
There are two scenario models in this program.
1. The first (previous section in this manual) looks at the potential size and value of the market given a price for each year.
2. The other (this page) helps you determine the optimum price point for a specific year depending on your priorities – market volume or revenue.
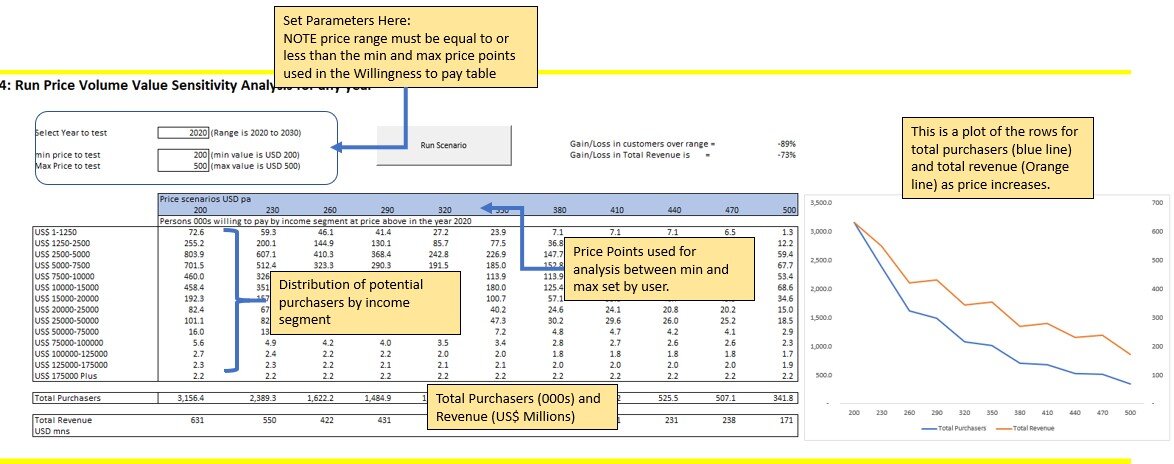
Price-Volume-Value Scenario
The intention of this stage is to help with the hardest marketing decision – what price?
By combining the willingness to pay by income data with the profile of persons in the market (have condition, and able to pay) by income it is possible to get an estimate of the market size and value across a range of price points for a specific year.
The core value of this is that it shows how volume and value change across that range and depending on business objectives, productive capacity etc, what might be the strategically best price point.
The user can run this model stage as often as they like.
The steps are:
- 1. select year to be examined
- 2. Set the price range to be tested – the model will test 9 points between the lowest and highest price point. Note that the permitted range of price points is determined by the range of the prices used in the willing to pay table.
- 3. Click ‘Run the Scenario’ button
THE RESULTING TABLE IS STRUCTURED AS FOLLOWS:
Area in blue is the range of prices used.
The table below is the distribution of potential purchasers by income (Note potential purchasers are those with the condition, able to pay at that price point and willing to pay)
The row labelled ‘Total Purchasers’ is the sum of each column and is the total number of potential customers.
The row Total Revenue (in US Dollars Millions) is the number of purchasers multiplied by the price shown in the blue section above.
By 2045
The total population of China is projected to decline to 1.378 billion persons – down from 1.411 in 2020 (Census). This assumes the average birth rate per thousand women aged 15 to 49 increases from 44 (in 2019) to 50 in 2024 and then declines to 46 by 2045, reflecting trends in improved education and affluence.
Annual births in 2024 are expected to be 15.7 million and are projected to decline to 12.4 million by 2035 and 11.541 million by 2045.
For more information on births in China, see our Special report on this topic
Learn More