


Epi, ability to pay willingness to pay model
Epidemiological, Ability to Pay and Willingness to Pay Model
Stage 2: Market Profile Section
The Sheet labelled ‘Market Profile’ gives summary of the demographic profile of the selected country.
The variables included can be tailored to client specific needs but the ones shown are typically the most relevant.
- Number of persons by gender
- Education profile (this significantly impacts willingness to pay and understanding health issues)
- Household income and propensity to spend - in both US Dollars and Local Currency
- The user can request other variables from those available in the Global Demographics Database if they are considered relevant. A listing of available variables is given at this page. There is a charge for customisation
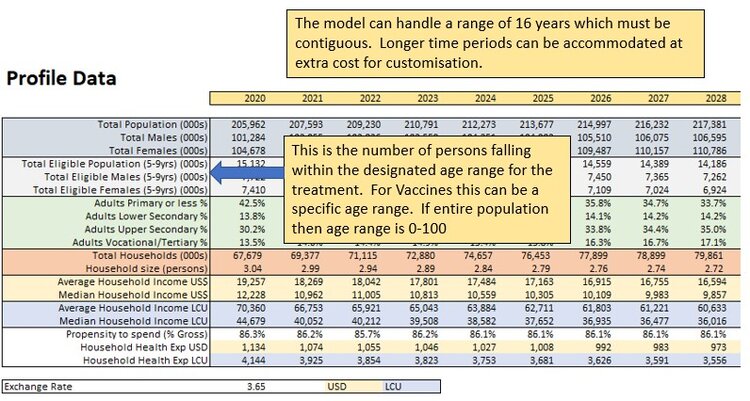
The second box of data is the number of persons in total and by gender that fall within the selected eligible age range for the vaccine. If user has select 0 and 100 for the age range on the Selection Stage then this will match the total population data in the databox above.
Note: In this example the financial data is United States Dollars using the 2019 exchange rate and 2019 deflators for the country. The Local Currency equivalent is also given in the blue shaded areas.
AGE BY GENDER TABLE
- The second table gives the age gender profile of the selected country.
- The standard version is 5 year age breaks but this can be varied to the client needs such as the format of the epidemiological data (customisation charge would apply). The underlying age data is held in 1 year steps in the Global Demographic’s database and as such we can aggregate any specific age range.
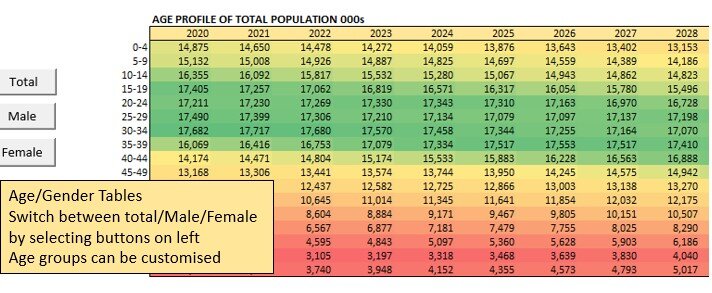
The user can switch from total to either gender by clicking on the buttons at the left.
Note: The selected age profile (Total/Male/Female) is also applied to the following subsequent Tables:
- distribution of the population by income
- Epidemiological profile
- Price-Volume-Value Trade off in Ability to Pay section
- Willingness to pay table
- Price-Volume-Value Trade off in Willingness to Pay section
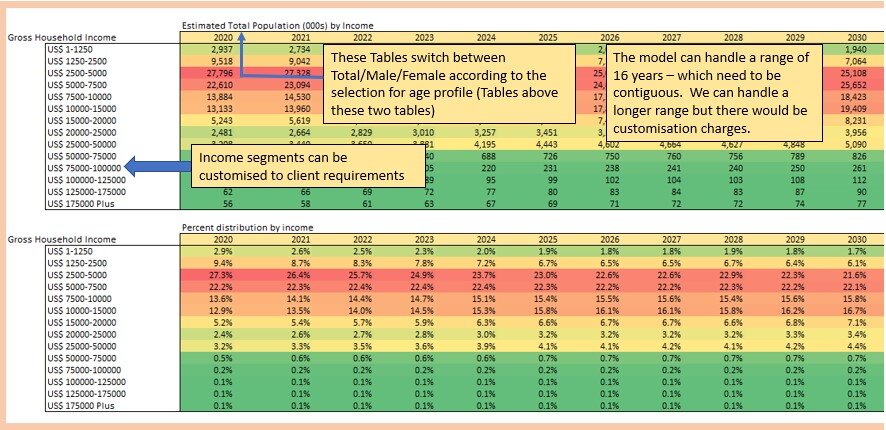
DISTRIBUTION OF PERSONS BY HOUSEHOLD INCOME TABLES.
This data is essential to the Ability to Pay and Willingness to Pay analysis.
Global Demographics Ltd have modelled the distribution of household by income mathematically and can output the distribution of the population/households by income using any client specific set of income breaks. The program can handle a maximum of 14 income breaks as shown in the example. The breaks shown are ones that have been found to be most useful for comparing across a wide range of countries with different levels of affluence.
Typically the income breaks shown here should match the income breaks used in the survey for collecting ‘willingness to pay’ data.
There are two tables – The first shows the estimated number of persons (total/male/female depending on earlier selection) in each income segment and the second table shows the percentage distribution of them.
Note that this table also changes from ‘Total’ to ‘Male’ or ‘Female’ depending on the selection for the Age by Gender Tables above.
GO TO THE NEXT SECTION OF THE MANUAL
By 2045
The total population of China is projected to decline to 1.378 billion persons – down from 1.411 in 2020 (Census). This assumes the average birth rate per thousand women aged 15 to 49 increases from 44 (in 2019) to 50 in 2024 and then declines to 46 by 2045, reflecting trends in improved education and affluence.
Annual births in 2024 are expected to be 15.7 million and are projected to decline to 12.4 million by 2035 and 11.541 million by 2045.
For more information on births in China, see our Special report on this topic
Learn More